East Bay real estate
fromABC7 San Francisco
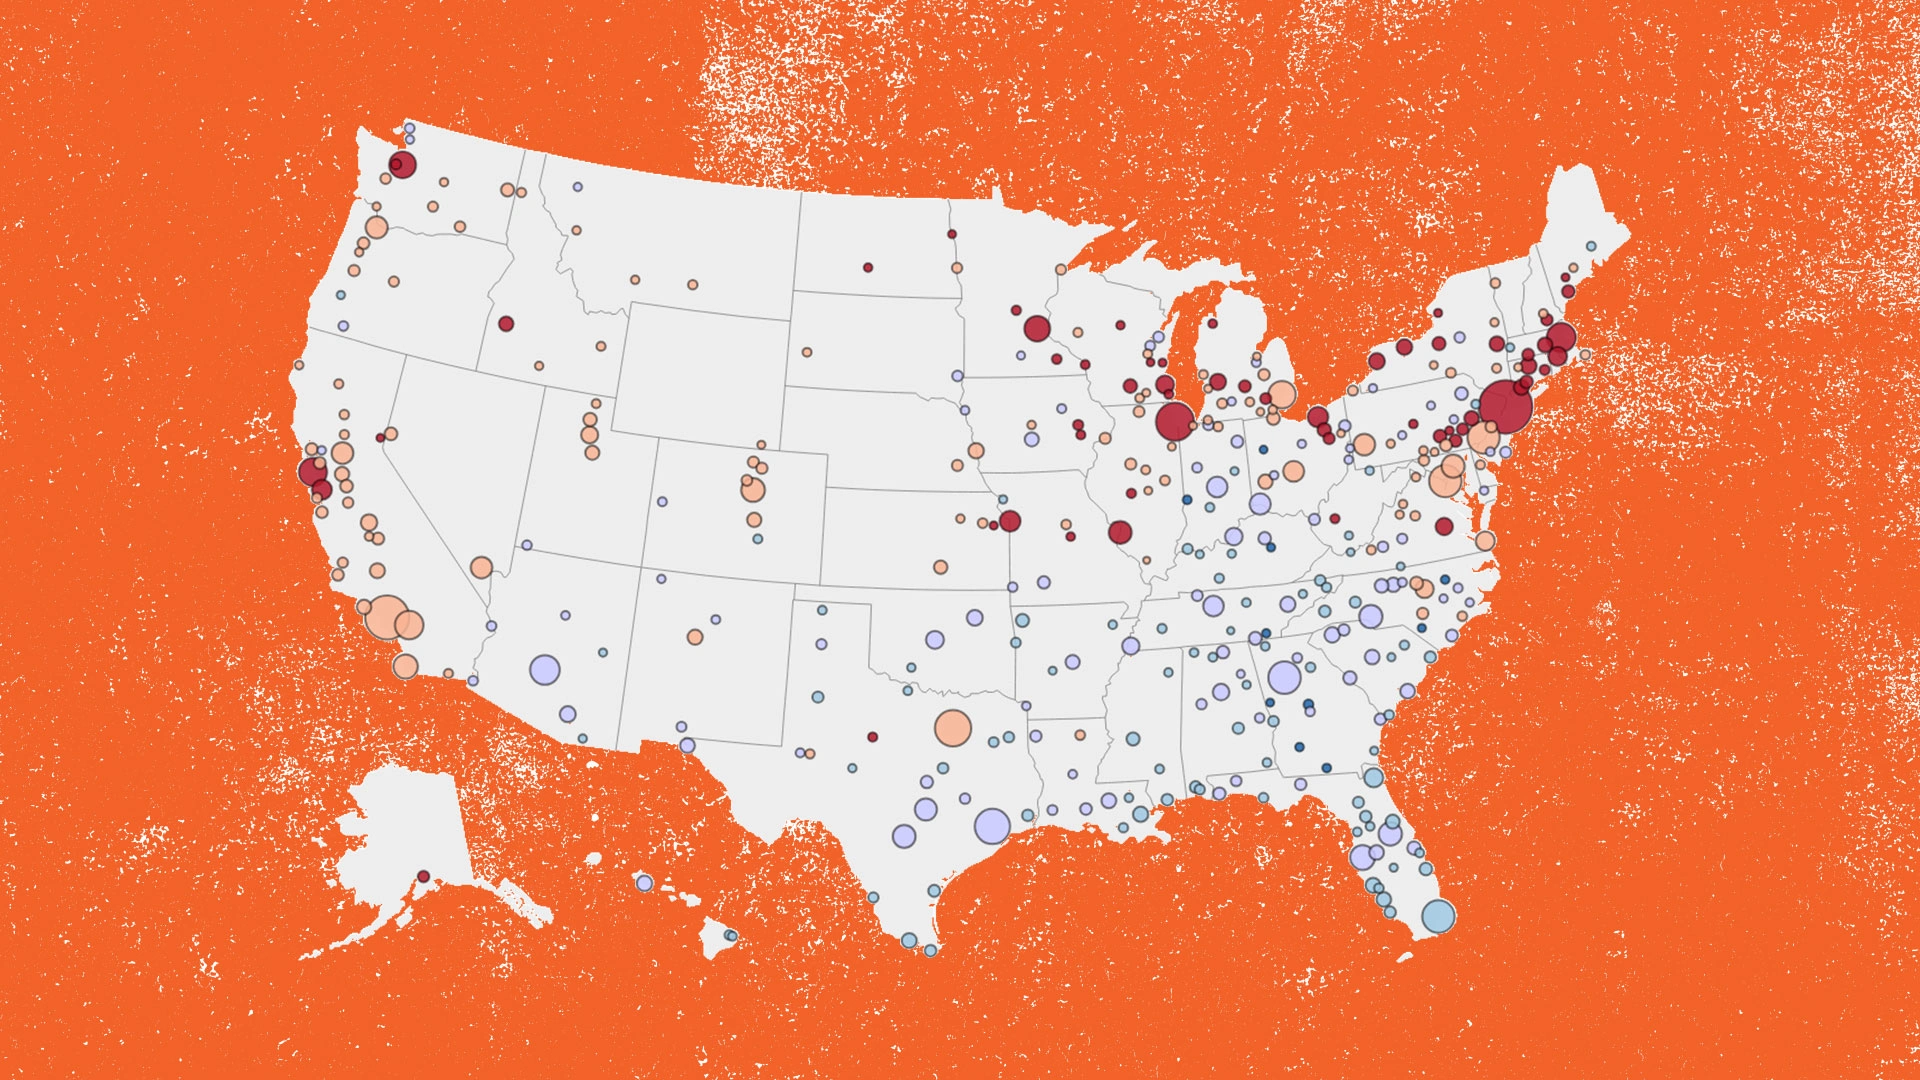
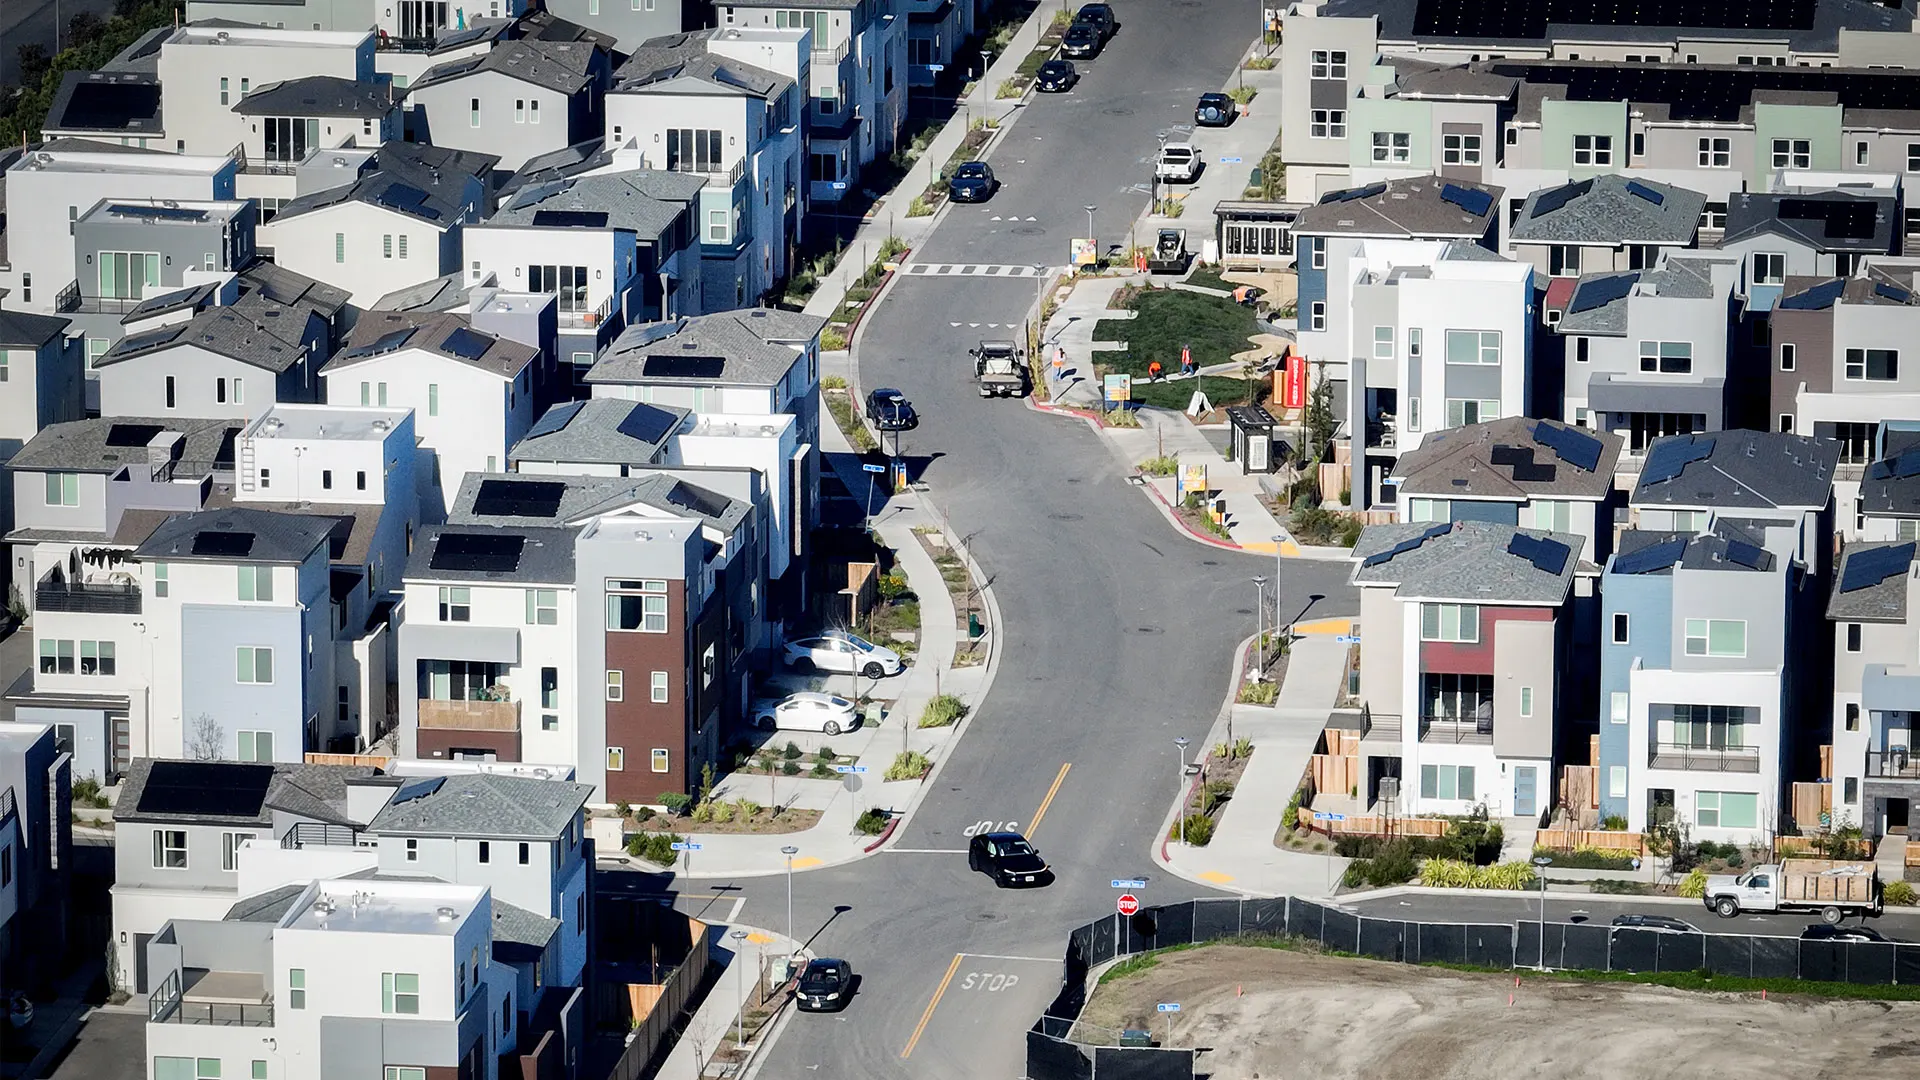
19 hours agoOakland home values drop more than 11% over past year, marking one of steepest declines in nation
Oakland home values fell 11.4% year over year, but neighborhood-level differences and buyer perceptions make the market more complex than a single figure.