"Zillow economists use an economic model known as the Zillow Market Heat Index to gauge the competitiveness of housing markets across the country. This model looks at key indicators-including home price changes, inventory levels, and days on the market-to generate a score showing whether a market favors sellers or buyers. Higher scores point to hotter, seller-friendly metro housing markets. Lower scores signal cooler markets where buyers hold more negotiating power."
"According to Zillow: Score of 70 or higher = strong seller's market Score from 55 to 69 = seller's market Score from 44 to 55 = neutral market Score from 28 to 44 = buyer's market Score of 27 or lower = strong buyer's market. Nationally, Zillow rates the U.S. housing market at 55 in spring 2026."
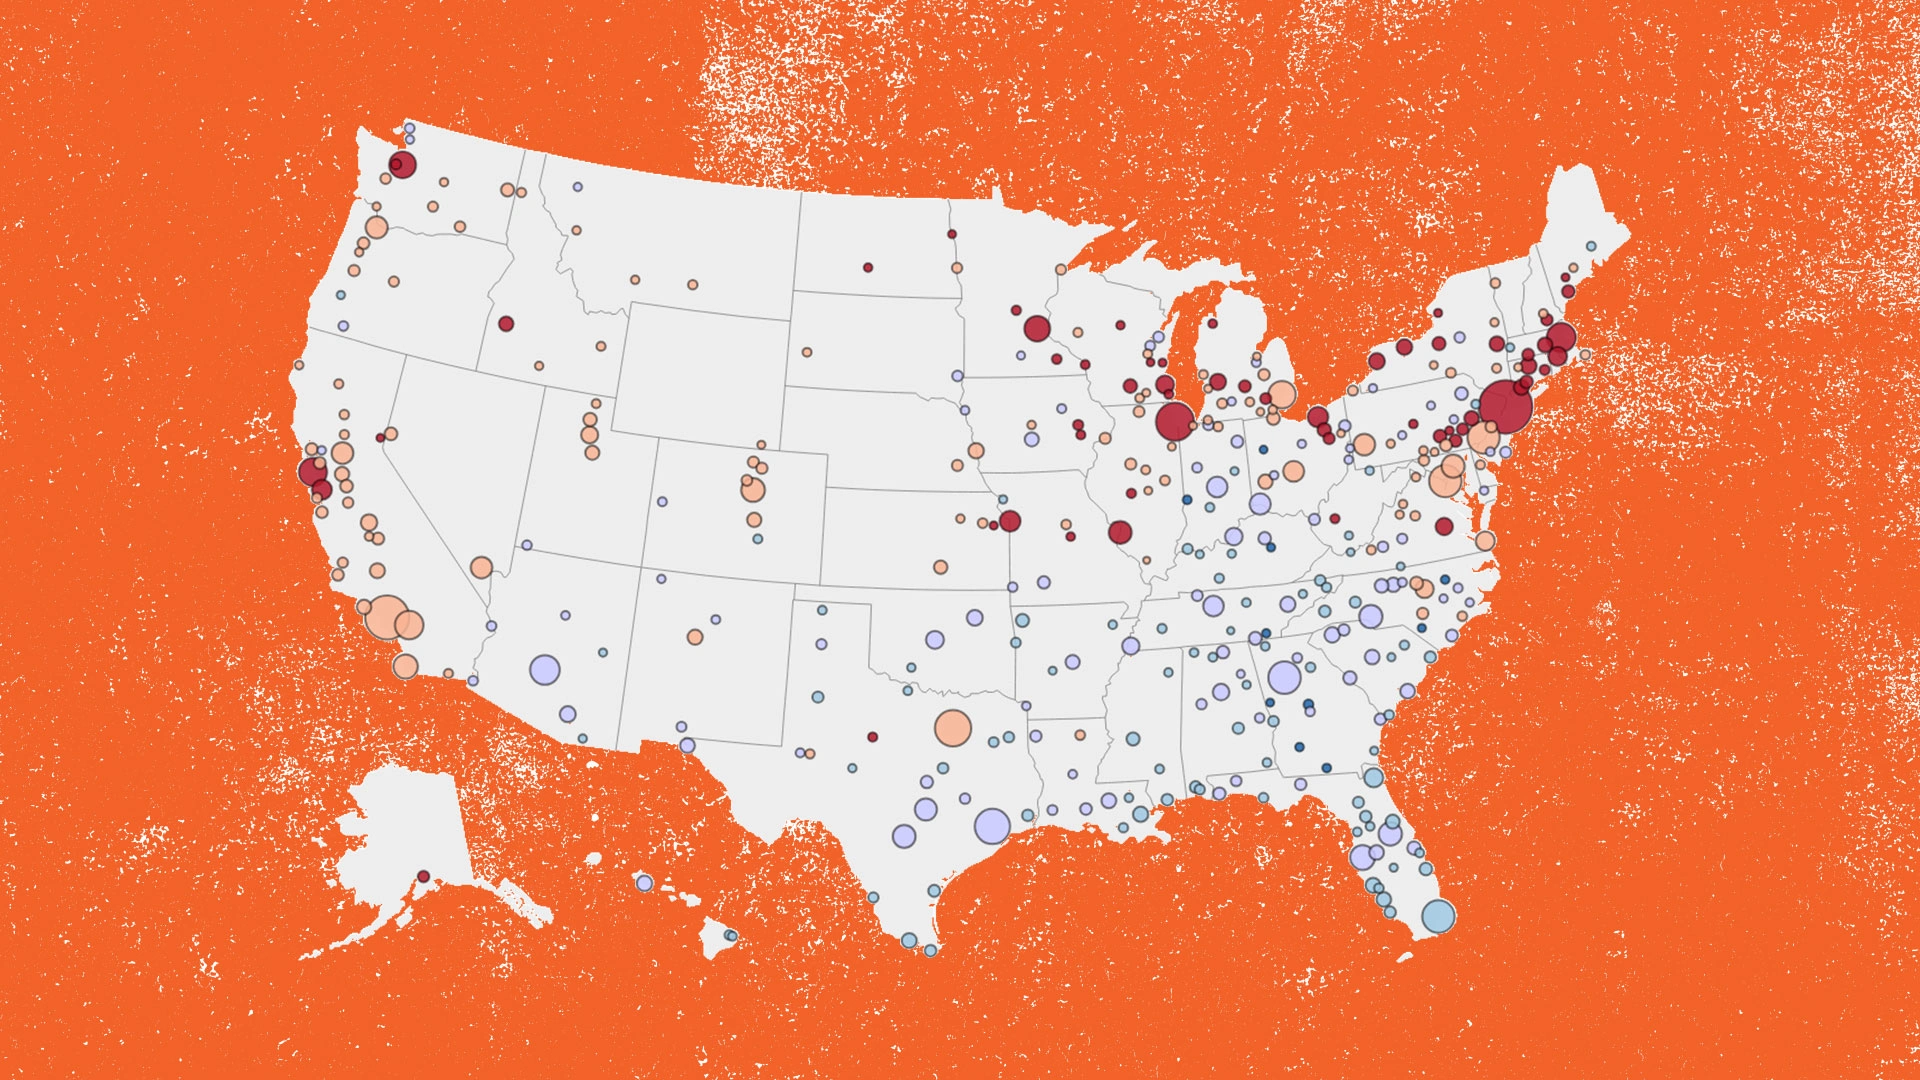
"That said, Zillow's reading varies significantly across the country. Rochester, New York → 174 Buffalo → 115 Racine, Wisconsin → 109 Syracuse, New York → 107 San Francisco → 105 Charleston, West Virginia → 103 Manchester, New Hampshire → 96 Hartford, Connecticut → 94 San Jose → 90 Albany, New York → 90 Milwaukee → 87 Bridgeport, Connecticut → 85 Rochester, Minnesota → 84 Poughkeepsie, New York → 81 Madison, Wisconsin → 81 Ann Arbor, Michigan → 81 Boston → 80 Grand Rapids, Michigan → 80 Springfield, Massachusetts → 79 Abilene, Texas → 79"
"Among the 250 largest metro-area housing markets, these 20 are the hottest markets, where sellers have the most power: Macon, Georgia → 25 Terre Haute, Indiana → 25 Florence, South Carolina → 27 Naples, Florida → 29 Brownsville, Texas → 30 Gulfport, Mississippi → 30 Longview, Texas → 30 Jackson, Tennessee → 34 Fort Smith, Arkansas → 35 Punta Gorda, Florida → 36 McAllen, Texas → 37 Cape Coral, Florida → 37 Miami → 38 Fayetteville, Arkansas → 38 Asheville, NC → 38 Laredo, Texas → 38"
Zillow uses the Zillow Market Heat Index to measure housing market competitiveness across the United States. The model incorporates home price changes, inventory levels, and days on the market to produce a score that indicates whether a metro area favors sellers or buyers. Higher scores correspond to hotter, seller-friendly markets, while lower scores correspond to cooler markets with more buyer negotiating power. In spring 2026, the national score is 55, indicating a seller-leaning market. Scores vary widely by metro, with some areas showing very hot conditions and others showing much cooler conditions. The hottest markets among the 250 largest metros include Macon, Georgia; Terre Haute, Indiana; and Naples, Florida, among others.
Read at Fast Company
Unable to calculate read time
Collection
[
|
...
]