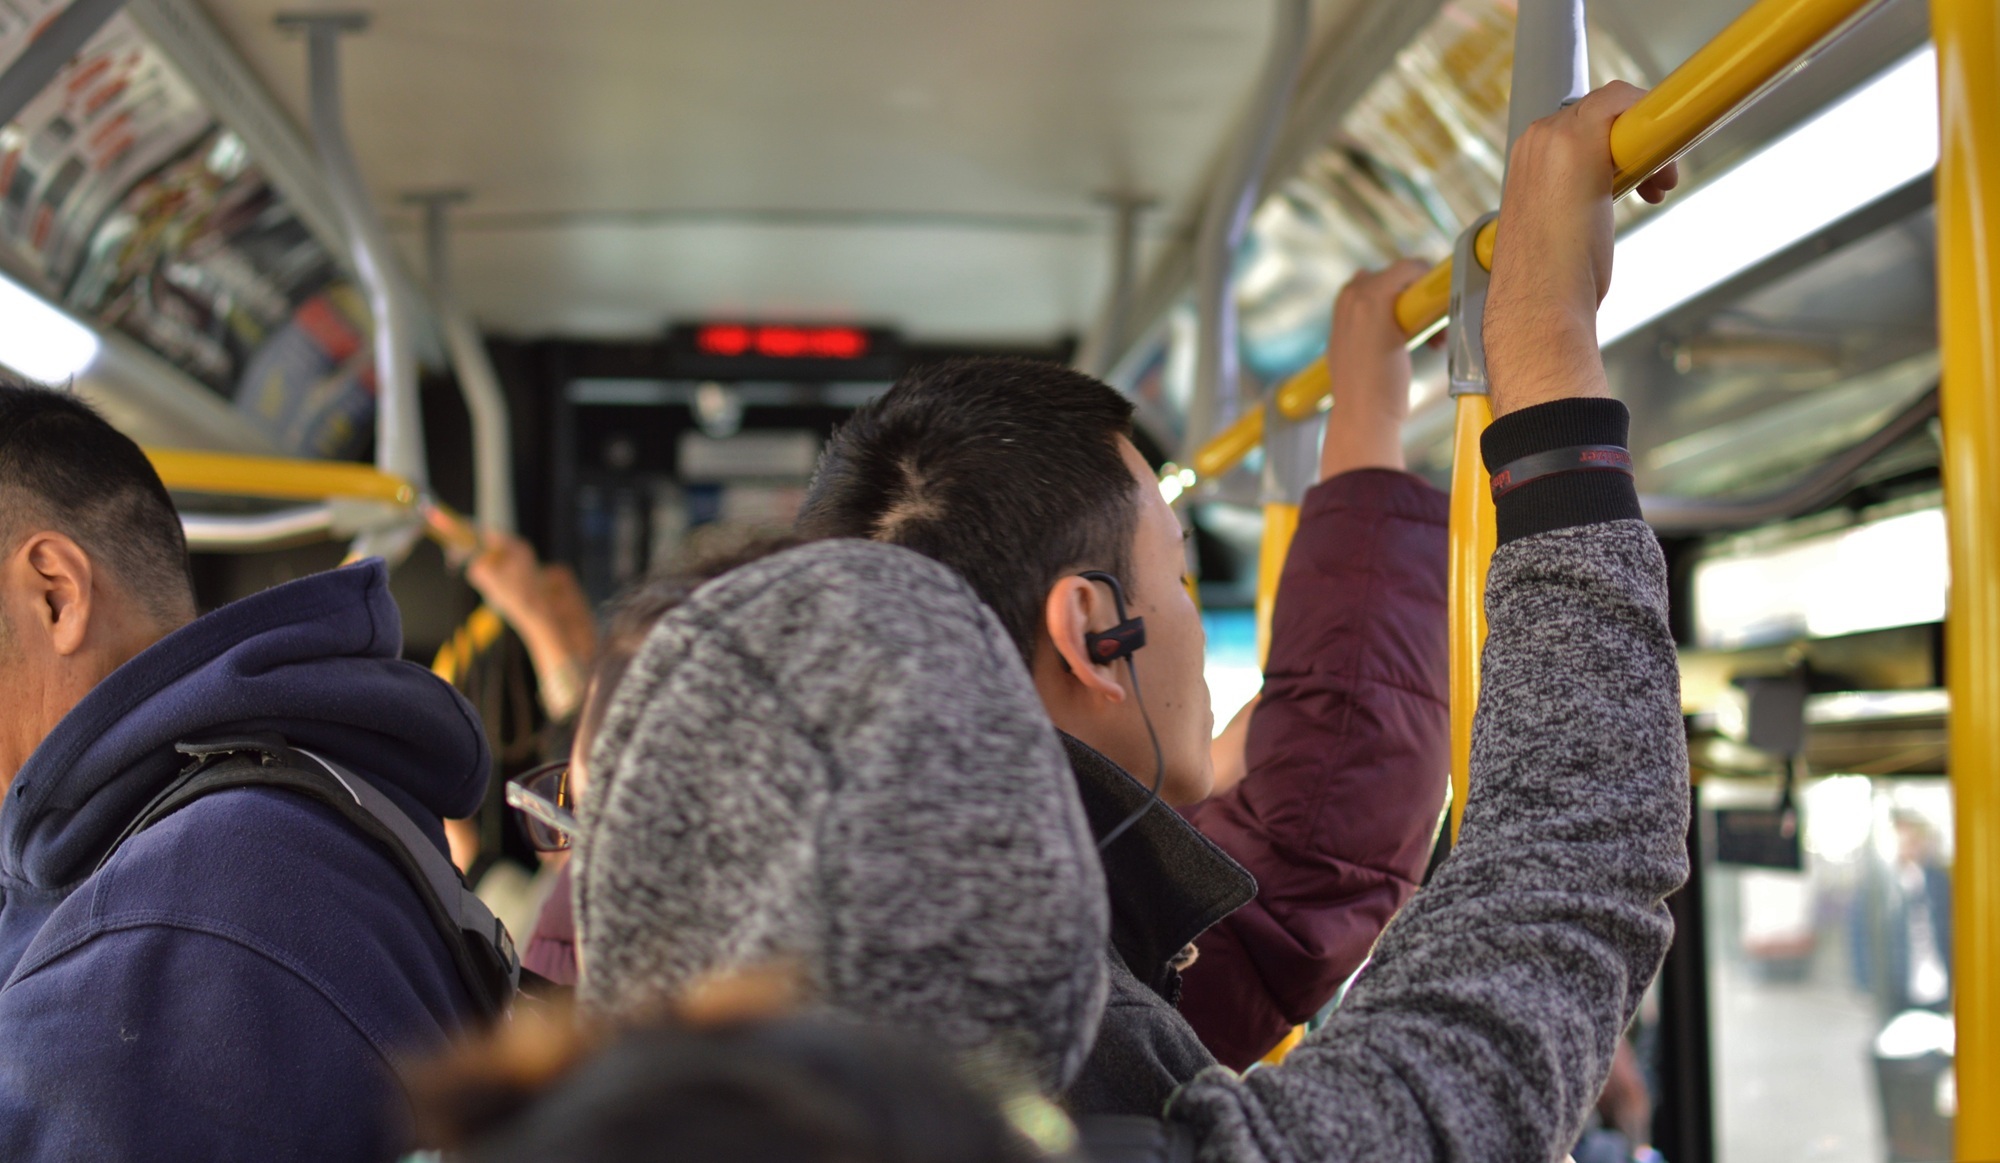
More than half of New York City bus lines — 56 percent — earned D or F grades, reflecting widespread slow and unreliable service. Manhattan suffered most, with 73 percent of lines failing and local speeds near five miles per hour due to gridlock. Citywide average local bus speed remains about eight miles per hour, unchanged from a decade ago. Brooklyn experiences frequent bunching, producing 20-minute gaps followed by multiple buses. Express services show faster bridge and highway speeds but poor on-time performance, with the ten lines under 50 percent on-time all being express. Scores improved 9.2 percent in the toll zone south of 60th Street between January and June 2025. A handful of lines earned A grades, including B31, B84, Bx29, Q35, S89 and SIM26. The MTA lacks transparent, line-by-line improvement goals.
"Manhattan buses were the undisputed dunces: A staggering 73-percent flunked, thanks largely to gridlock that slows buses to a crawl of around five miles per hour. That's slower than a jogger in Central Park. "This is our effort to help provide a report card system that helps us get out of life in the slow lane and get those buses moving faster," Lander said, framing the findings as both wake-up call and rallying cry."
"Brooklyn fared little better. Its buses bunch more often than anywhere else, leaving riders stranded for 20 minutes only to have two buses show up at once. Express buses, meanwhile, hit higher speeds on bridges and highways but couldn't be counted on to arrive anywhere near their scheduled time. In fact, all 10 lines with on-time rates below 50-percent were express services."
Read at Time Out New York
Unable to calculate read time
Collection
[
|
...
]