"In this post, we'll explore how to calculate scoring runs in Pandas using a step-by-step approach to analyze college basketball tournament data."
"By utilizing the shift() method, we can effectively track when a scoring run starts by comparing the current team with the previous team."
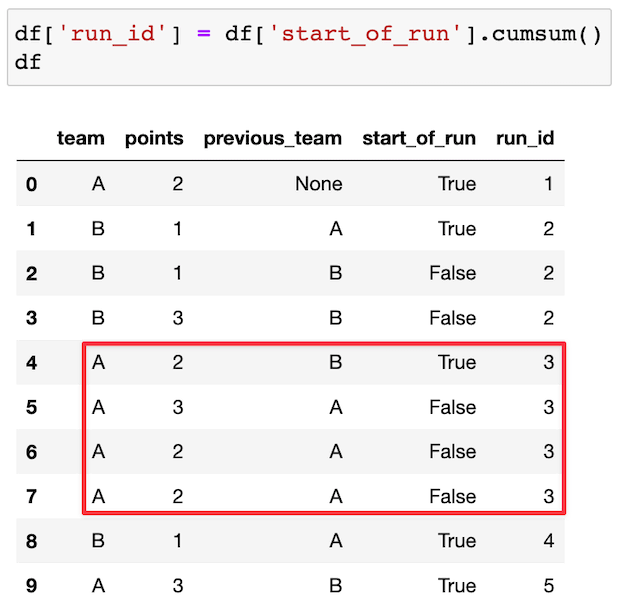
"Each unique scoring run can be assigned an ID using the cumsum() method on a boolean column, which helps us easily group and analyze the data."
"Josh Devlin's blog has inspired this method to determine scoring streaks, demonstrating how simple Pandas functions can reveal significant insights in sports data."
The article explains how to analyze scoring runs in college basketball using Pandas. It begins with example scoring data, demonstrating how to identify when a team starts a scoring run by comparing each team's scoring event with the previous one. The author describes using the shift() method to create a column that helps determine the start of runs. By applying the cumulative sum (cumsum) function, scores are assigned unique IDs for easier tracking. The discussion also references Josh Devlinâs blog, providing valuable insights into applying data analysis techniques in sports contexts.
Read at Data School
Unable to calculate read time
Collection
[
|
...
]