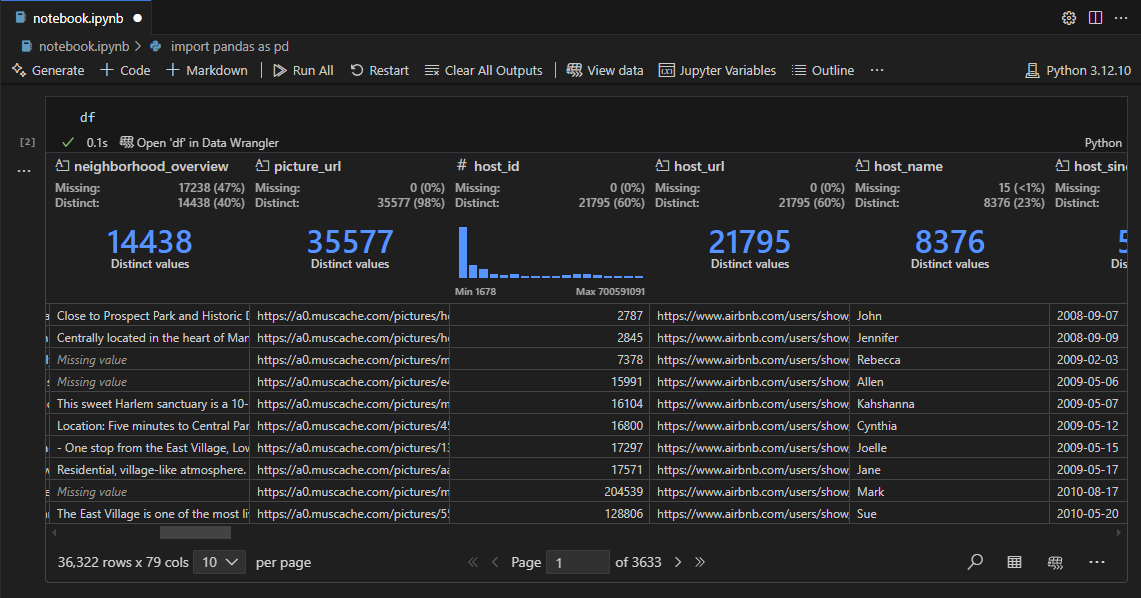
"The new experience seamlessly replaces the static HTML output for Pandas DataFrames, allowing users to easily identify rogue blank values, duplicates, and data types."
"With Data Wrangler's interactive UI, users can sort and filter data without writing any code, significantly improving data exploration efficiency within notebooks."
"Users can access summaries, statistics, and frequency distributions instantly, as well as utilize the full Data Wrangler experience for advanced data cleaning operations."
"The ability to export data as CSV or Parquet files enables further analysis or integration into data pipelines, making the process more streamlined."
Data Wrangler transforms the Pandas DataFrames experience in VS Code by replacing static HTML outputs with an interactive UI. Users can easily identify issues like missing values, check for unique entries, and understand data types without writing code. Key features include automatic detection of blank and distinct values, access to in-depth statistics and frequency distributions, and a one-click transition to an expanded cleaning interface. The tool also allows for easy data export as CSV or Parquet, facilitating further analysis and pipeline integration.
Read at Microsoft for Python Developers Blog
Unable to calculate read time
Collection
[
|
...
]