#telemetry-harbor

[ follow ]
fromAdrelien - Your Source for Tech News, Tutorials, and Reviews
5 months ago

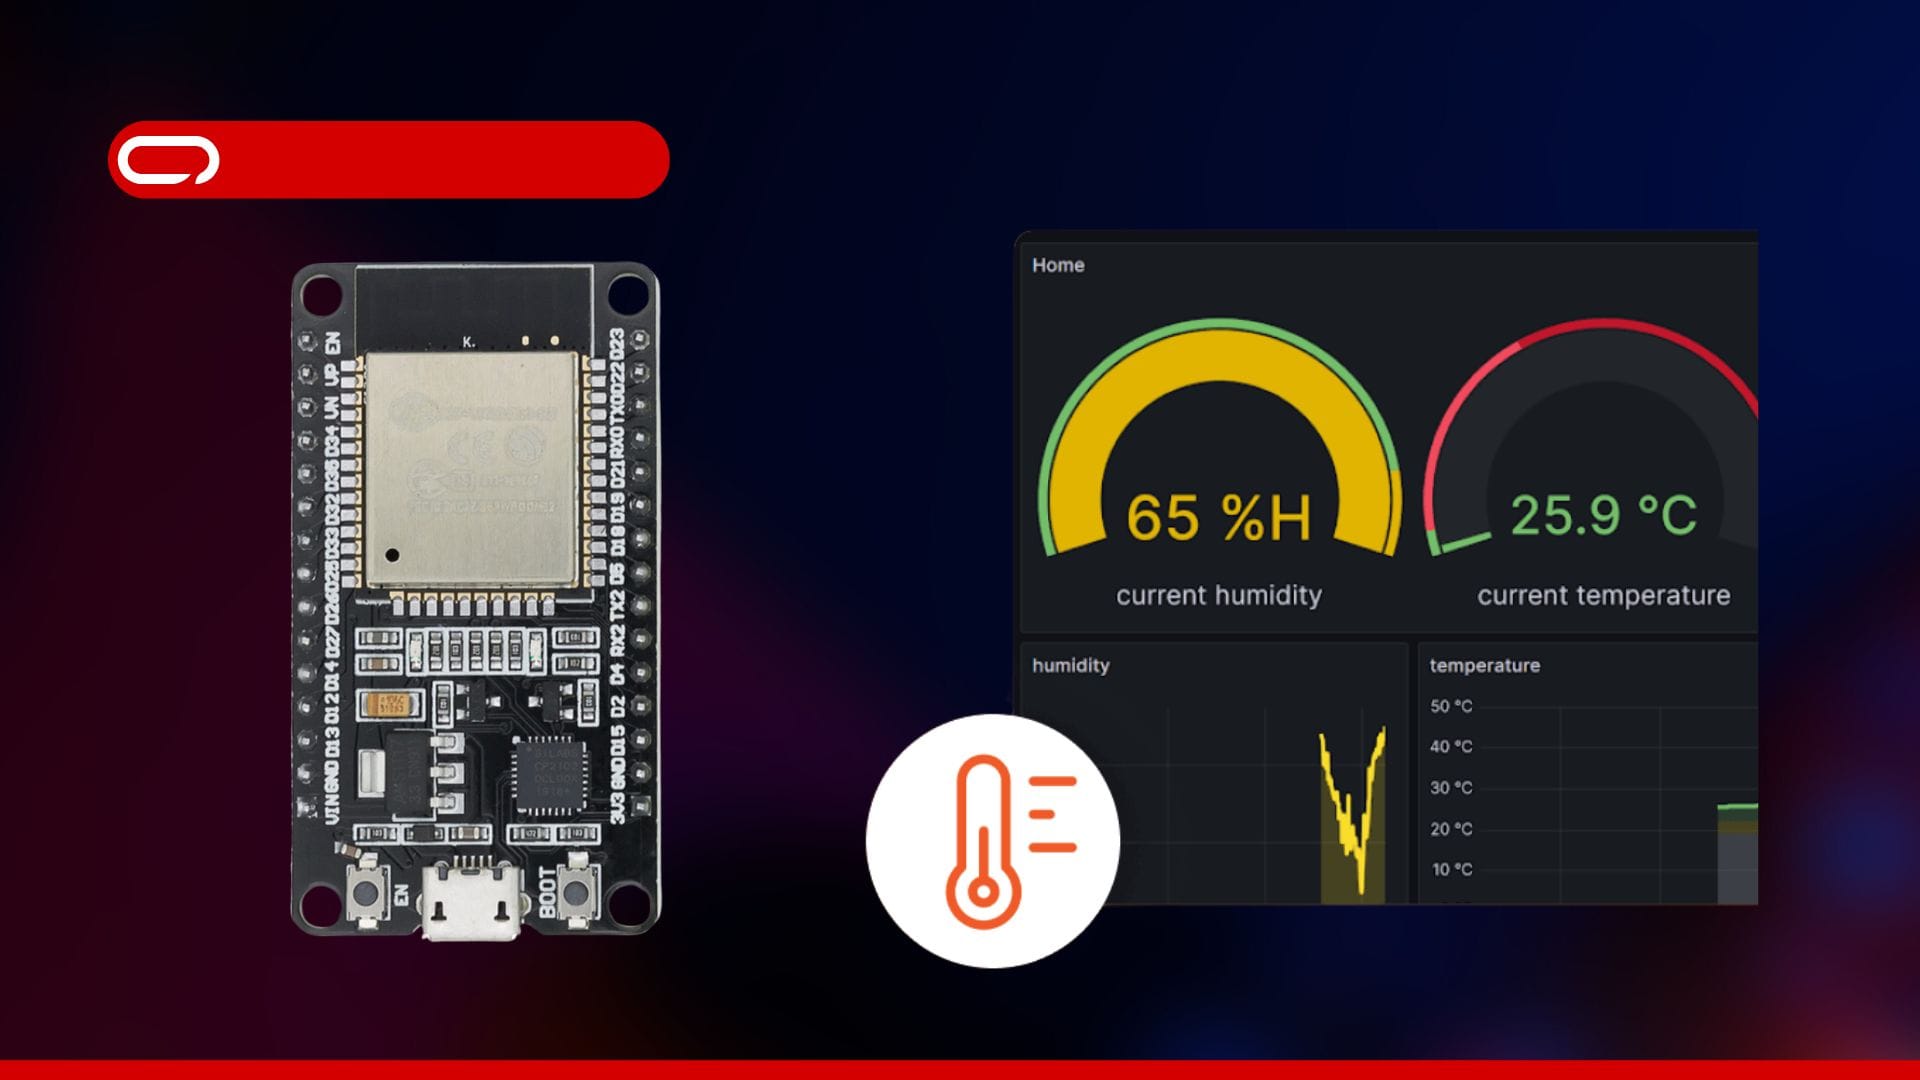
How to Visualize The Things Network Data in Grafana (Real-Time & Easy)

You've deployed LoRaWAN sensors. They're transmitting to The Things Network perfectly. But here's where most people get stuck: turning that raw sensor data into actual dashboards you can use. If you've searched for "The Things Network Grafana visualization" or "how to store TTN data," you've probably found tutorials that require setting up InfluxDB, configuring Telegraf with MQTT, wrestling with Docker containers, or paying for Azure IoT Hub. Hours of configuration, multiple moving parts that can break, and the constant burden of maintenance.
Gadgets
fromAdrelien - Your Source for Tech News, Tutorials, and Reviews
7 months ago

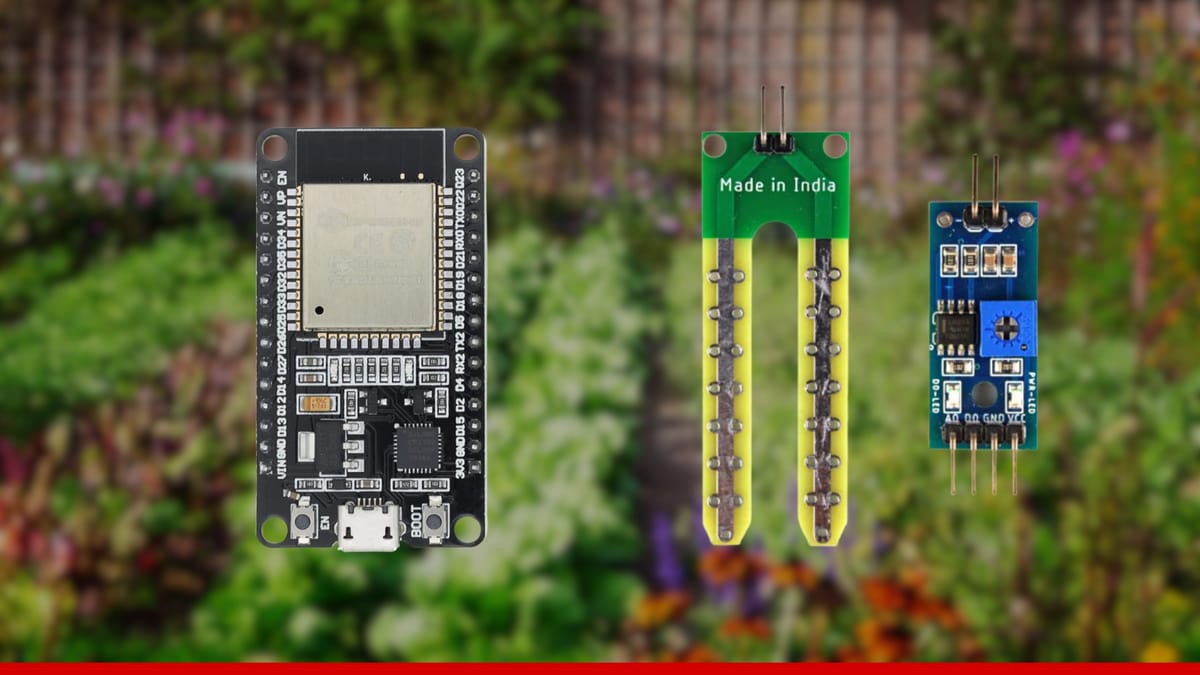
ESP32 Soil Moisture Sensor: Real-Time Monitoring & Visualization

Adrelien inESP32 -The ESP32 is a powerful microcontroller with built-in Wi-Fi, making it an excellent choice for IoT projects. In this guide, we will walk you through how to collect soil moisture data from a 2-prong soil sensor, send it to the cloud using Telemetry Harbor, and visualize it using a Grafana dashboard Arduino IDE (1.8.13 or newer) Required libraries: Telemetry Harbor SDK WiFi Library (built into ESP32 core) HTTPClient Library (built into ESP32 core) Telemetry Harbor account (free tier available)
Gadgets
[ Load more ]