from.:: Marcos Dione/StyXman's glob ::.
1 day agoJavaScript
Monitoring Apache with SQL and Grafana
Apache access logs can be ingested into SQLite with regex parsing to enable Grafana-style metrics without high-cardinality TSDB systems.
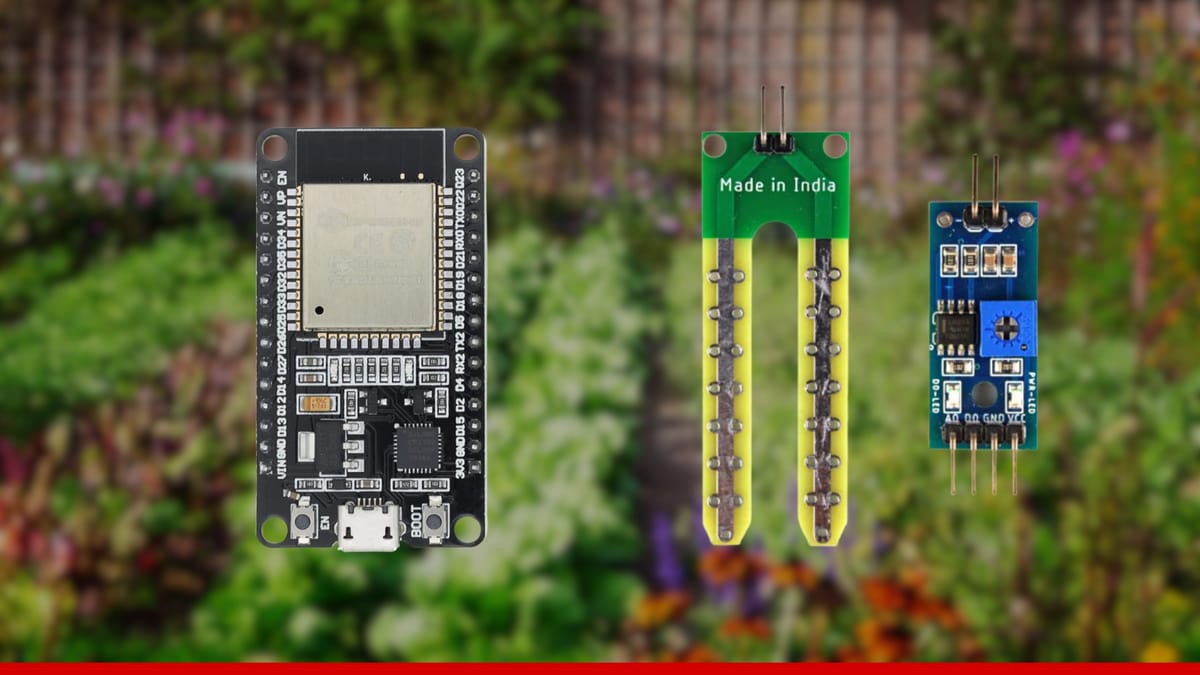
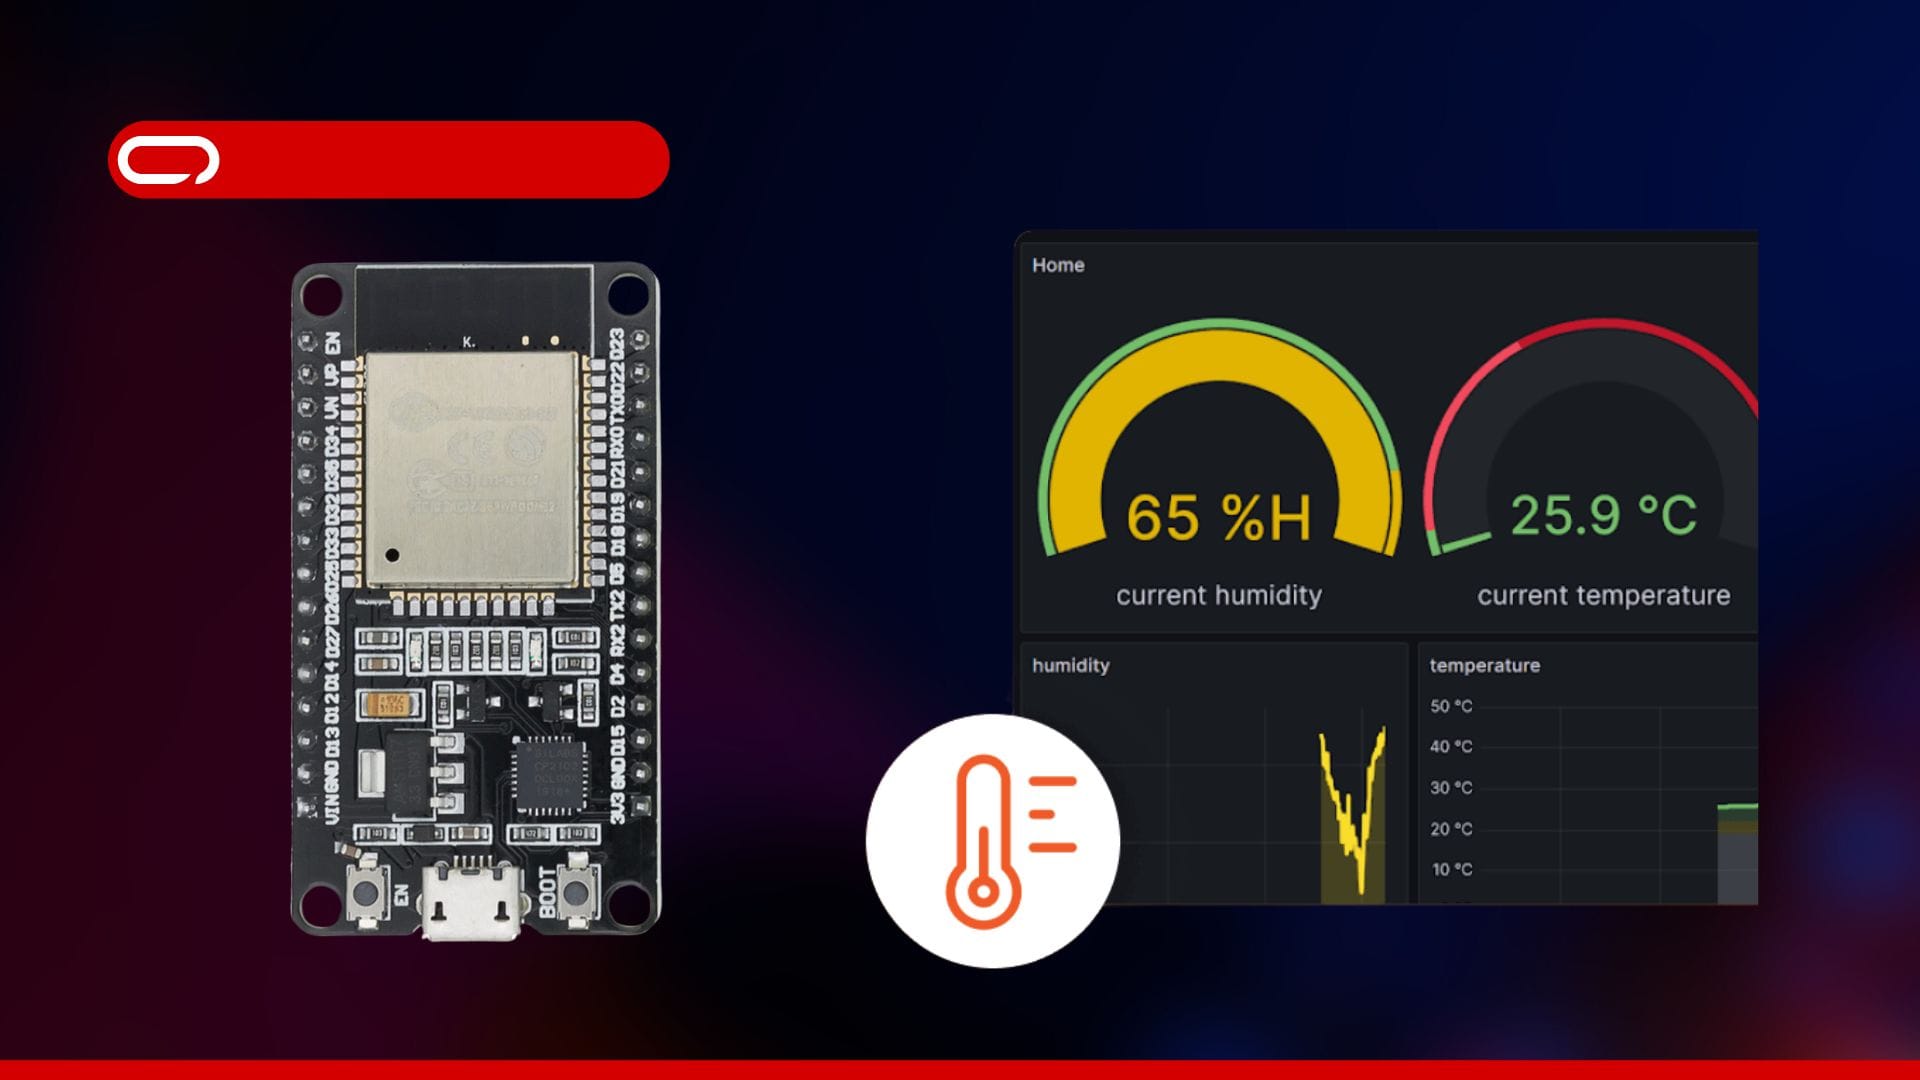
You've deployed LoRaWAN sensors. They're transmitting to The Things Network perfectly. But here's where most people get stuck: turning that raw sensor data into actual dashboards you can use. If you've searched for "The Things Network Grafana visualization" or "how to store TTN data," you've probably found tutorials that require setting up InfluxDB, configuring Telegraf with MQTT, wrestling with Docker containers, or paying for Azure IoT Hub. Hours of configuration, multiple moving parts that can break, and the constant burden of maintenance.
From a technical standpoint, the solution relies on a lightweight serverless function (such as an AWS Lambda) that receives GitLab webhooks via an API Gateway endpoint, formats the payload as structured logs, and ships them into Grafana Cloud Logs. Users can then use LogQL queries to analyze CI/CD activity by project, deployment success rates, or build times. Furthermore, these logs can be combined with application performance data in Grafana dashboards, for example, seeing error rates plotted alongside specific deploys or code changes.
Richi Hartmann highlighted that the aim is to ensure a consistent set of APIs and a uniform JSON data schema for simple integration of Grafana dashboards across multiple applications.