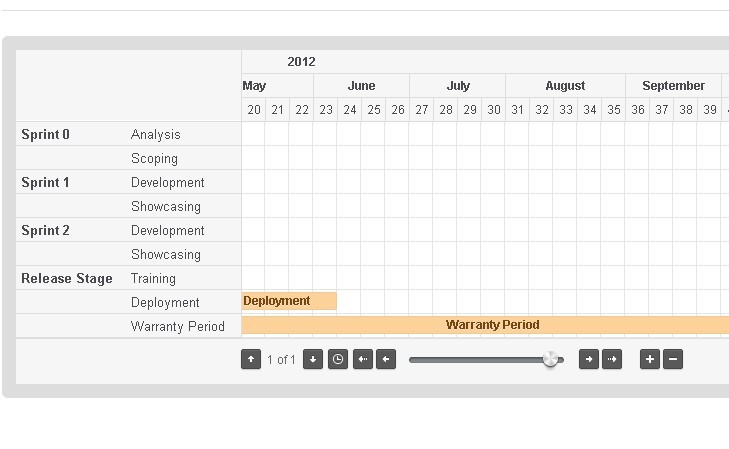
jQuery Gantt Chart generates interactive Gantt charts from JSON data or via AJAX. Include the jQuery library and the plugin, then create an HTML placeholder for the chart. Define data objects with fields such as name, desc, and values containing from/to timestamps, label, desc, customClass, and dataObj metadata. Call $(".gantt").gantt({ source: myData }) to render. The plugin supports pagination (itemsPerPage), holidays, localisation arrays for days and months, custom wait text, navigation controls, and accepts data sources as JS objects or URLs.
"var myData = [{ name: "Name 1", desc: "Description 1", values: [{ from: 1320192000000, // date string to: 1322401600000, label: "Label 1", desc: "Value Description 1", customClass: "custom-1", dataObj: {} }] },{ name: "Name 2", desc: "Description 2", values: [{ from: 1320192000000, to: 1322401600000, label: "Label 2", desc: "Value Description 2", customClass: "custom-2", dataObj: {} }]"
"$(".gantt").gantt({ // holidays holidays: [], // how many items per page itemsPerPage: 7, // localisation dow: ["S", "M", "T", "W", "T", "F", "S"], months: ["January", "February", "March", "April", "May", "June", "July", "August", "September", "October", "November", "December"], waitText: "Please wait...", // navigation type // or '"
Read at www.jqueryscript.net
Unable to calculate read time
Collection
[
|
...
]