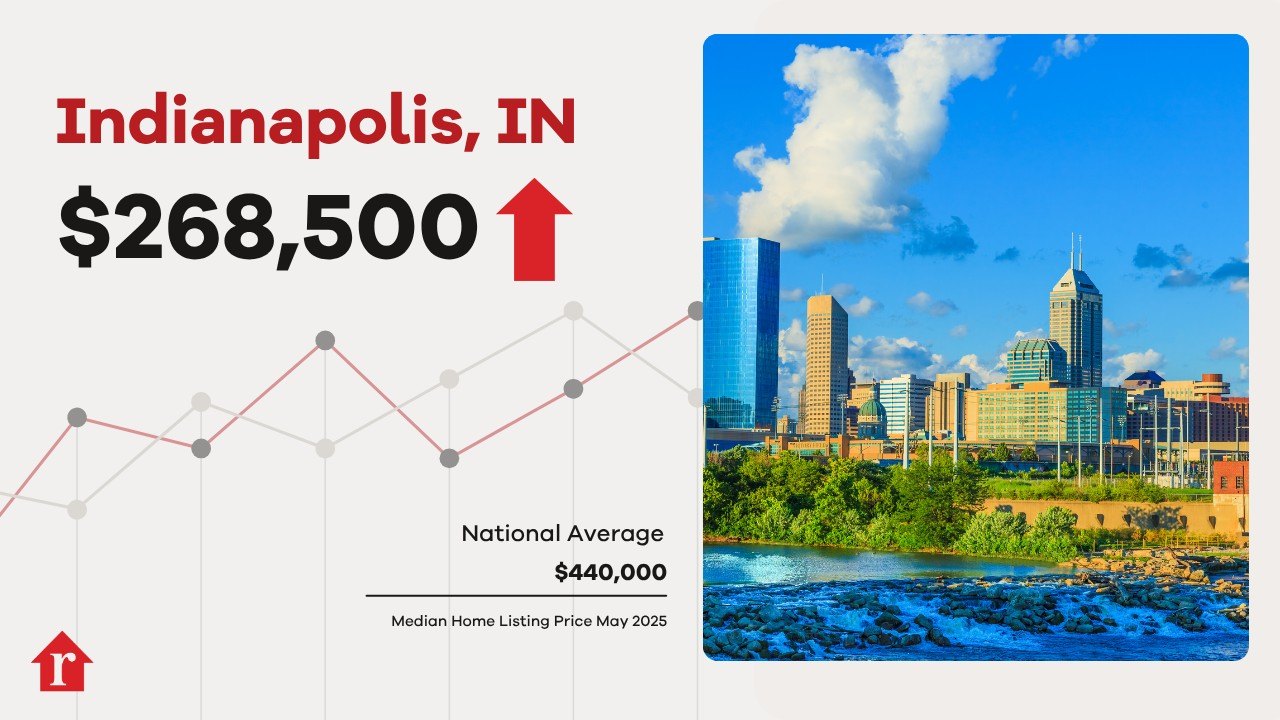
"In May, home prices rose moderately from the month before, with a median listing price of $268,500. The number of listings on the market grew 12.9%, which is a bigger increase than normal for this time of the year in Indianapolis, and homes are also selling slower than at the same time last year. Home prices in Indianapolis Typically, home price per square foot in Indianapolis tend to rise in May."
"But the most recent data shows that the price per square foot decreased by 0.3% compared with the month before. So, how does this compare with the rest of the U.S.? Nationally, home price per square foot increased 0.5%, which means price changes in Indy are lagging behind the national market."
"Indianapolis inventory In May, there were 2,023 homes for sale in Indianapolis, which was 12.9% more than the month before and 29.0% more than the same time last year. Meanwhile, active inventory across the nation rose by 8.0% from last month to 1,036,101. Time on market Homes in Indianapolis take an average of 44 days to sell, according to May figures. This is the same as the previous month and four days more than the same month last year. For comparison, nationally homes spent an average of 51 days on the market in May."
In May, Indianapolis median listing price rose to $268,500. Monthly listings grew 12.9% and active inventory reached 2,023 homes, up 29.0% from last year. Price per square foot in Indianapolis fell 0.3% from the prior month, contrary to the typical May increase and behind the national per-square-foot rise of 0.5%. Homes in Indianapolis averaged 44 days on market, unchanged from April and four days longer than the same month last year. Nationally, active inventory rose 8.0% to 1,036,101 listings and homes averaged 51 days on market. Local market shows more supply and slightly slower turnover.
Read at SFGATE
Unable to calculate read time
Collection
[
|
...
]