"In the 1980s, there were 33 weather events that caused at least $1 billion in damages (inflation adjusted) - or 3.3 per year. With each decade passing, the yearly average of such events increases. In the 1990s, there were 5.7 such events per year on average, in the aughts the average was 6.7 per year, in the 2010s it was 13.1, and in the last three years it was 22 billion-dollar events per year, including 28 in 2023 - the most of any year."
"Not only the number of events is increasing, but also the damages they are causing. If in the 1980s the annual cost of such disasters was about $18.4 billion, it reached nearly $99 billion per year in the 2010s, and a whopping $119.5 billion a year in the last three years. Also, since 2020, there have been 20 weather events that caused over $5 billion in damages. (Also see, Ranking the Most Powerful Hurricanes of All Time.)"
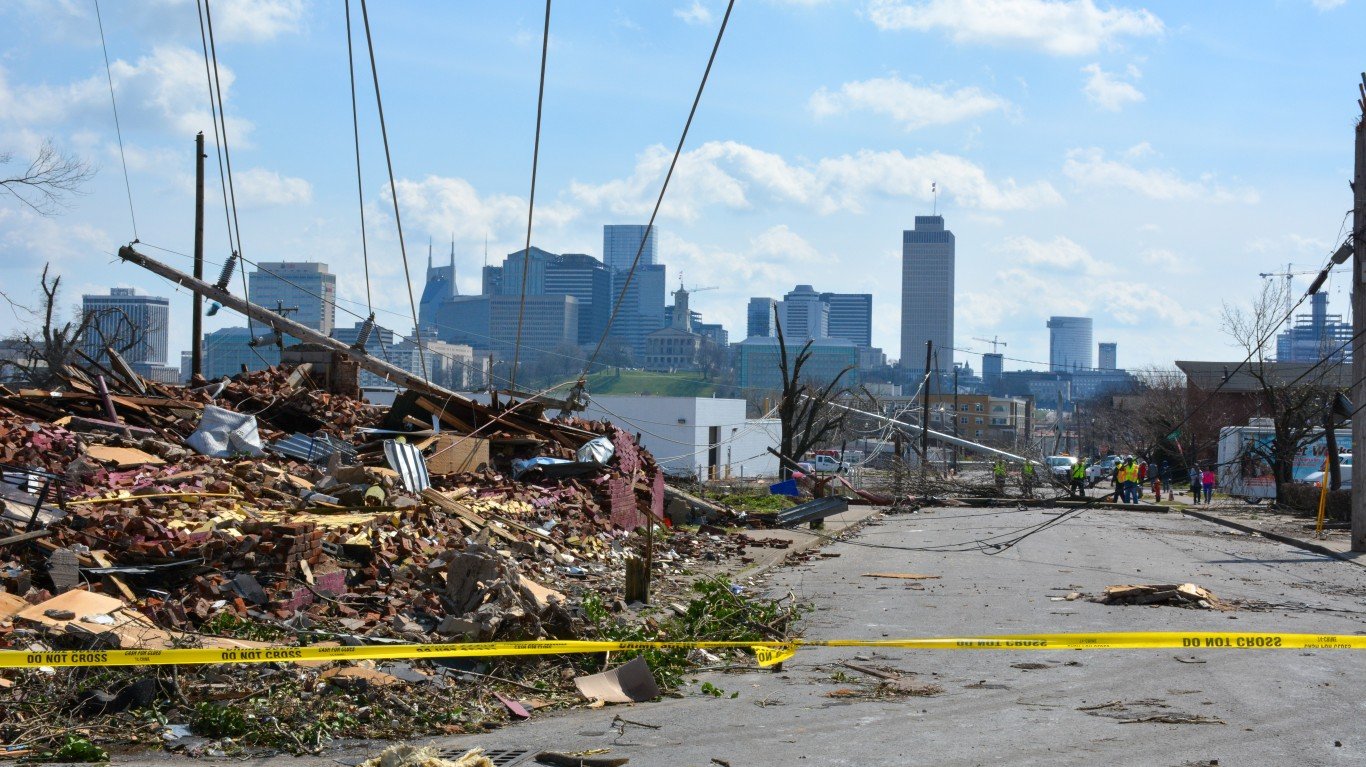
Annual counts of U.S. billion-dollar weather events rose from 3.3 per year in the 1980s to averages of 5.7 in the 1990s, 6.7 in the 2000s, 13.1 in the 2010s, and 22 per year in the last three years, with 28 events in 2023. Annual costs increased from about $18.4 billion in the 1980s to nearly $99 billion in the 2010s and $119.5 billion per year in the most recent three-year period. Since 2020, twenty weather events caused over $5 billion in damages. NOAA's National Centers for Environmental Information identifies 20 events of $5 billion or more, consisting of two winter storms, three wildfires, four droughts, five severe storms, and six tropical cyclones. Scientific studies indicate that human-induced warming makes extreme weather events more frequent or intense, and higher development and population contribute to larger monetary damages in the U.S.
Read at 24/7 Wall St.
Unable to calculate read time
Collection
[
|
...
]