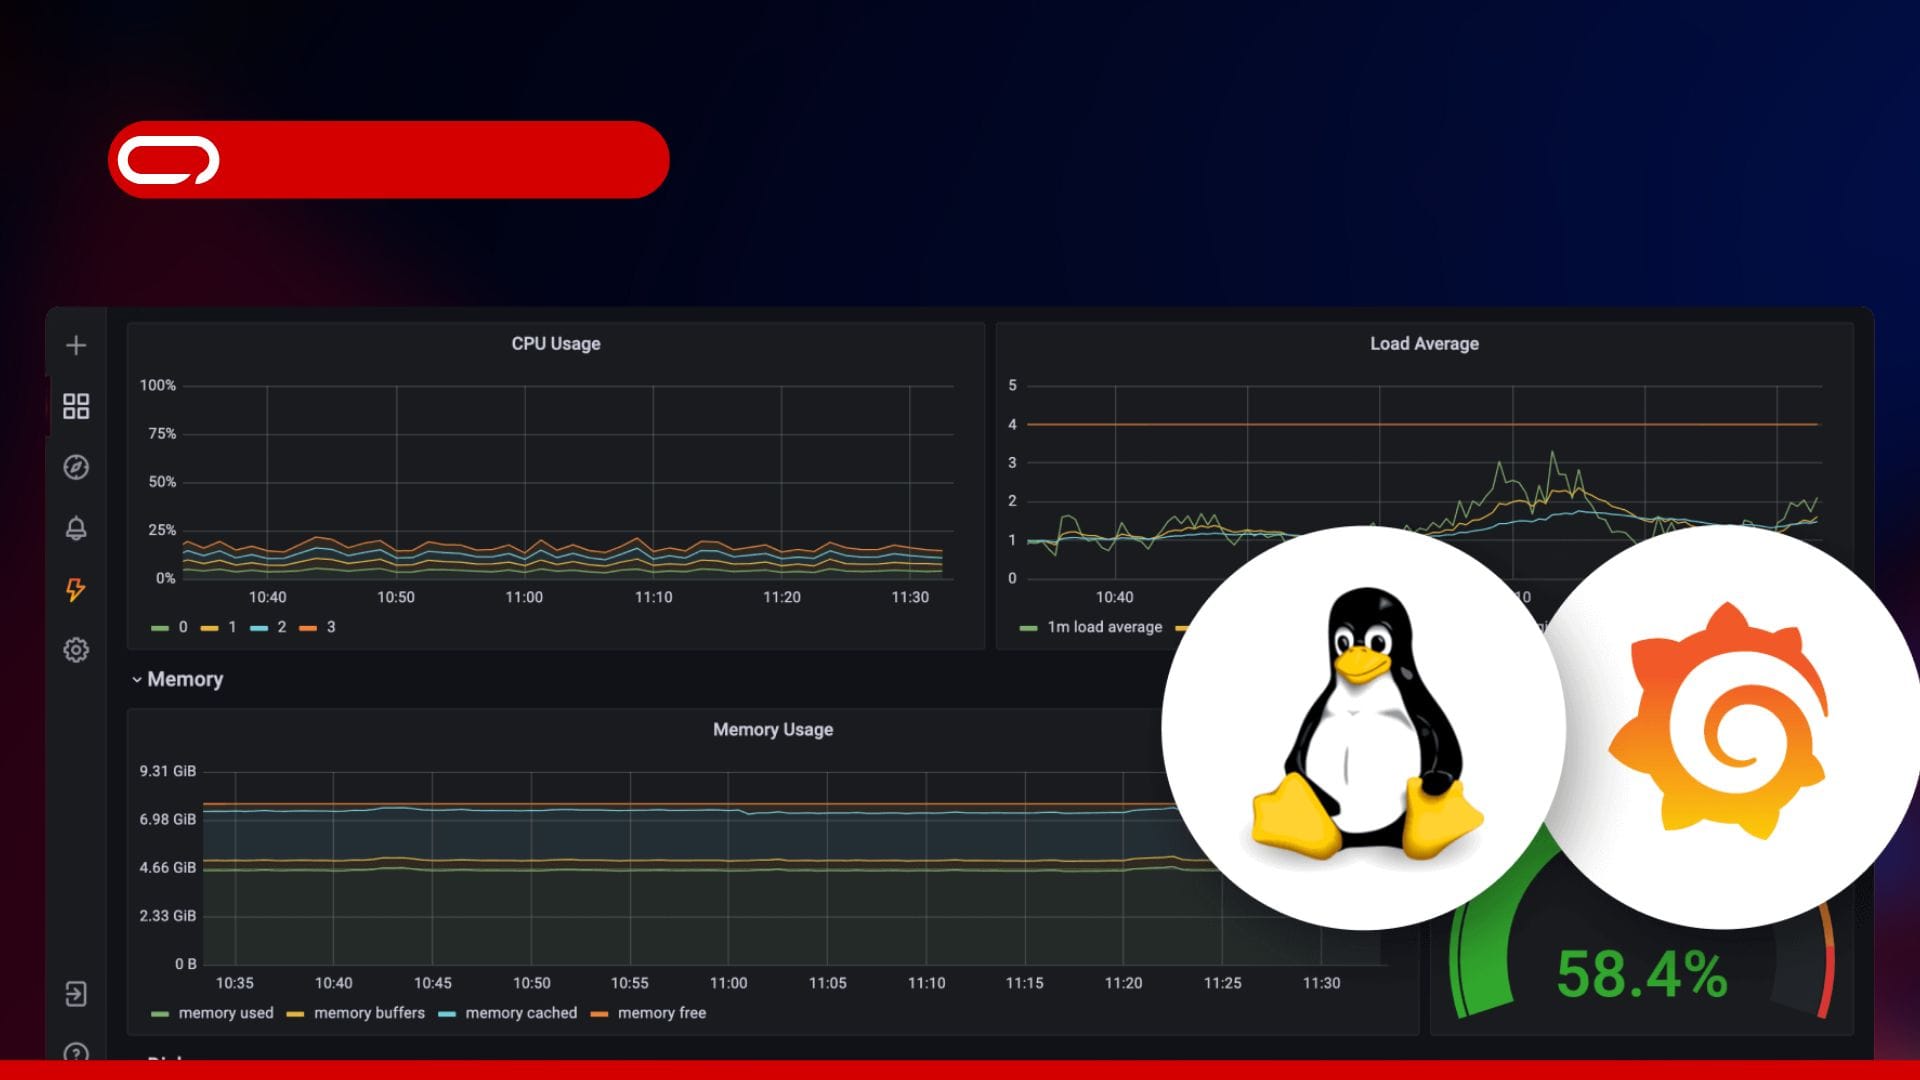
"With a quick installation process and over 24 metrics available out-of-the-box, Telemetry Harbor’s Linux Monitoring Agent dramatically simplifies server monitoring."
"Setting up proper monitoring for Linux systems has traditionally been a pain, requiring significant time to configure complex monitoring stacks, but Telemetry Harbor changes that."
"Telemetry Harbor collects comprehensive metrics out of the box and offers customization options to suit various monitoring needs, enhancing visibility of Linux systems."
"The seamless integration with Grafana enables users to create beautiful dashboards instantly, making monitoring not only effective but also visually appealing."
Telemetry Harbor's Linux Monitoring Agent offers a revolutionary solution for managing server monitoring. With a simple installation process taking mere minutes and providing over 24 pre-configured metrics, it minimizes the challenges historically associated with Linux monitoring. This solution requires minimal setup effort, allowing users to customize metrics and sampling rates. Extensive Grafana integration ensures immediate access to visually appealing dashboards. Administrators, often burdened by complex setups, will find Telemetry Harbor a refreshing alternative that enhances visibility and efficiency while simplifying monitoring processes.
Read at Adrelien - Your Source for Tech News, Tutorials, and Reviews
Unable to calculate read time
Collection
[
|
...
]