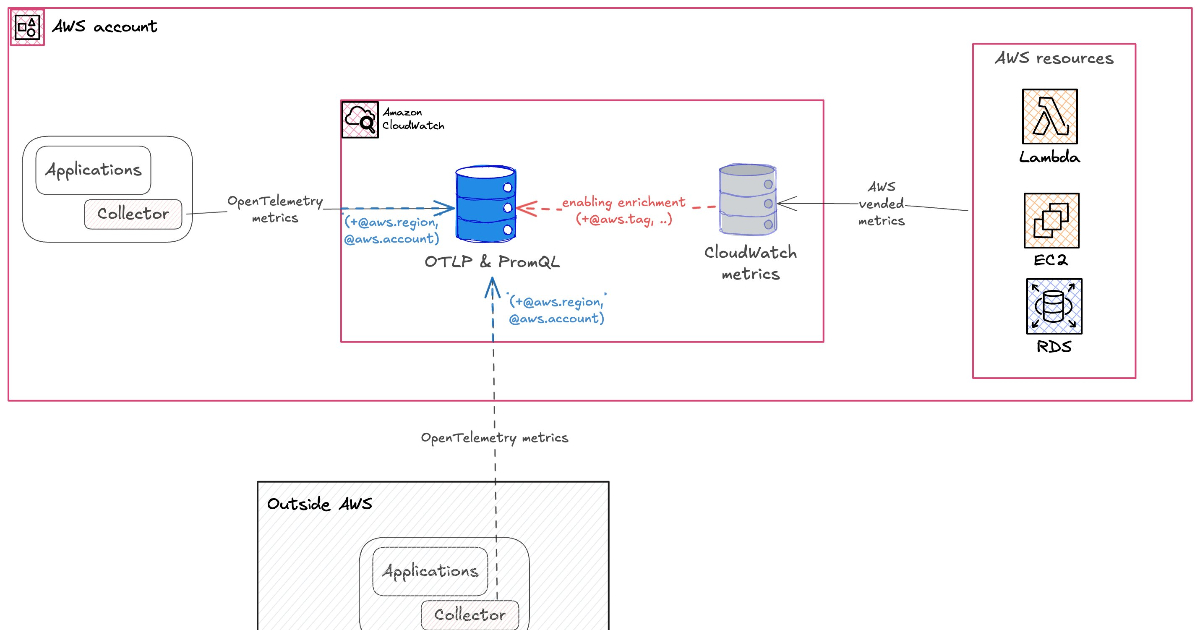
"With this launch, CloudWatch completes its support for OpenTelemetry across all three pillars of observability. CloudWatch already accepts traces and logs through its OTLP endpoints, adding native OTLP metrics ingestion means you can now send all your telemetry to CloudWatch using open standards, through a single protocol."
"Teams can then analyze them using PromQL, the query language used in Prometheus to retrieve and analyze monitoring metrics, in the CloudWatch console, and build dashboards and alarms to monitor applications across environments, including Kubernetes clusters and on-premises systems."
"This capability fundamentally changes how you query and filter metrics across your AWS."
AWS has launched the public preview of OpenTelemetry metrics support in Amazon CloudWatch, allowing developers to send metrics directly using the OpenTelemetry protocol. This update features a high-cardinality metrics store supporting up to 150 labels per metric. CloudWatch now serves as a centralized platform for infrastructure, container, and application metrics. The integration of PromQL enables teams to analyze metrics and build dashboards, enhancing monitoring capabilities across various environments, including Kubernetes and on-premises systems.
Read at InfoQ
Unable to calculate read time
Collection
[
|
...
]