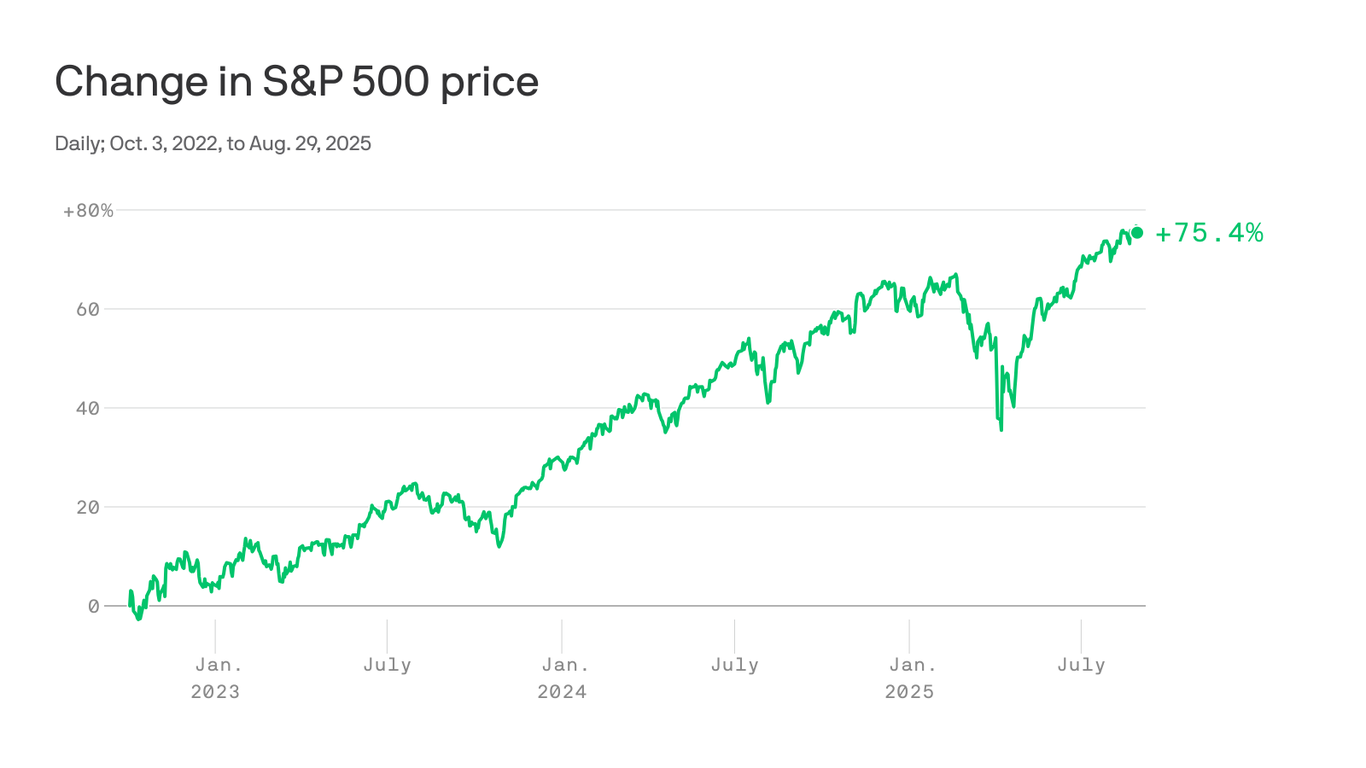
Historical data show 14 past bull markets averaged 177% gains over 59 months. The S&P 500 has risen roughly 80% since the October 2022 lows, indicating potential additional upside compared with historical patterns. Historical technical indicators are not predictive and omit risks including high valuations, market concentration, macroeconomic volatility and policy uncertainty. The S&P 500 price-to-book ratio stands at about 5.3, the highest since 1946. Bulls expect rate cuts, AI-driven growth and possible 2026 fiscal stimulus, while stronger-than-expected second-quarter earnings create a conditional path for more gains or potential disappointment.
"In the last 100 years, the average gain among 14 bull markets has been 177% over 59 months. Based on that data, the S&P has more room to run, as stocks are "only" up about 80% since the October 2022 lows. Yes, but: Of course, this is a technical indicator, looking at past performance, which is not indicative of future results. This doesn't take into account some of the market risks we've covered, ranging from valuations to concentration to macro and policy risks."
"The bottom line: Bulls are focused on rate cuts, the AI narrative and stimulus that could come in 2026. Many investors foresee stimulus from the "one big beautiful bill" outweighing tariff-driven price pressures. The earnings growth seen in second-quarter results has outpaced expectations, setting the market up for either more gains ahead, or potential disappointment. For example, the current S&P 500 price-to-book ratio is at the highest level since 1946, at 5.3 times, BofA also notes."
Read at Axios
Unable to calculate read time
Collection
[
|
...
]