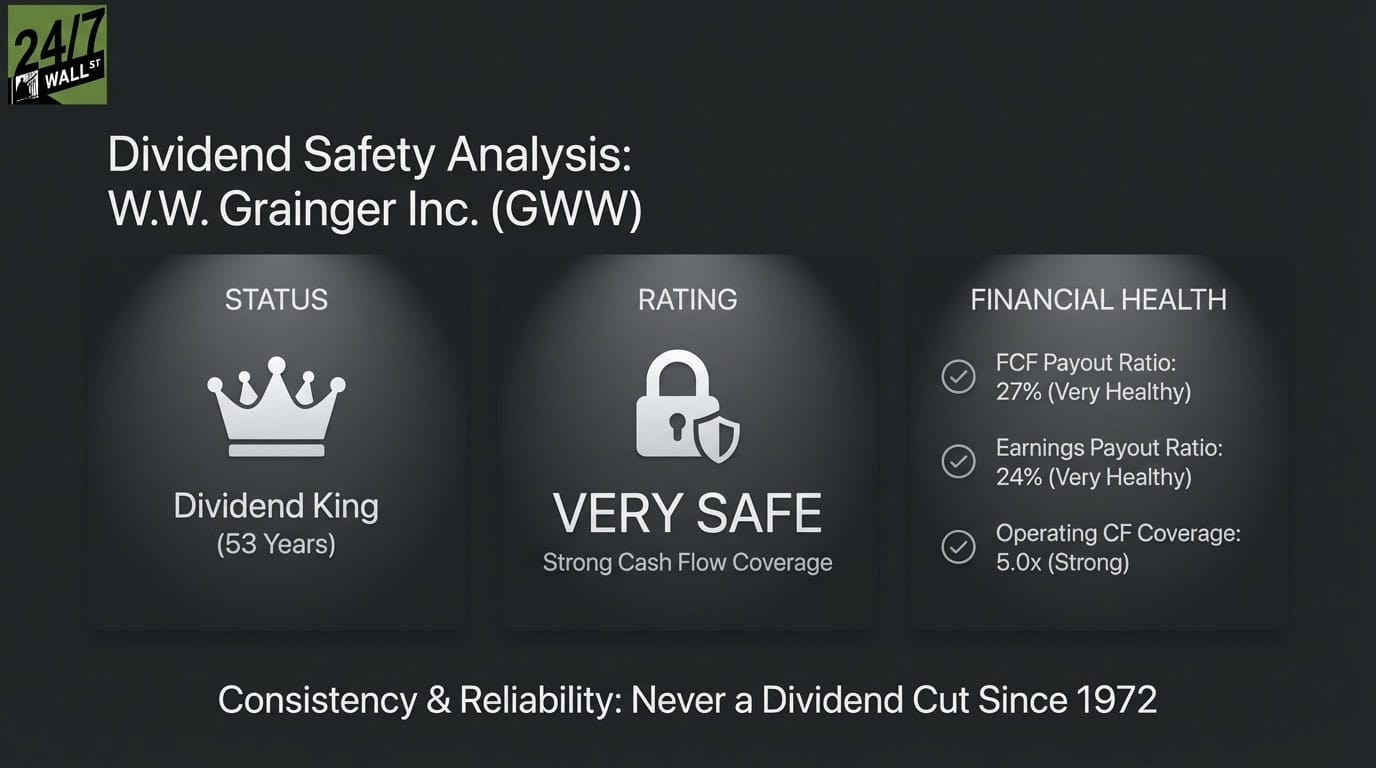
"Grainger generated $2.11 billion in operating cash flow in 2024 against $421 million in dividend payments. That gives the company 5.0x coverage, meaning it produces five dollars of operating cash for every dollar paid to shareholders. After subtracting $541 million in capital expenditures, free cash flow came to $1.57 billion, covering the dividend 3.7 times over. The free cash flow payout ratio sits at 27%, leaving substantial room for dividend growth or economic downturns."
"Grainger has raised its dividend every year since 1972. The five-year compound annual growth rate stands at approximately 6%, with annual increases ranging from 5% to 8% in recent years. Total dividend payments have grown from $316 million in 2018 to $421 million in 2024, a 33% increase over six years. The company has never cut its dividend, even during the 2008 financial crisis or the 2020 pandemic."
W.W. Grainger pays an $8.62 annual dividend per share, yielding 0.89%, and has increased dividends every year since 1972. Operating cash flow in 2024 was $2.11 billion versus $421 million in dividend payments, providing 5.0x coverage. After $541 million in capital expenditures, free cash flow was $1.57 billion, covering dividends 3.7x. The free cash flow payout ratio is 27% and the earnings payout ratio is 24% based on $35.70 EPS. Five-year dividend CAGR is about 6%, with total dividend payments rising 33% from 2018 to 2024. Cash metrics and low payout ratios support dividend durability.
Read at 24/7 Wall St.
Unable to calculate read time
Collection
[
|
...
]