"Grafana Tempo is an open source, high-scale distributed tracing backend designed to store massive volumes of trace data cost-effectively, typically backed by object storage. It's often deployed alongside Grafana for visualization and Loki/Prometheus for logs and metrics."
"Distributed tracing solves this by connecting request flows across service boundaries into a unified view, providing span-level visibility across every hop (API gateway, auth service, payment processor, message bus, background worker) all linked by shared trace context."
"With tracing in place, you can follow a single trace ID through every service and system it touches, see time spent in each operation including external calls and database queries, correlate failures with specific deployments or configuration changes, and identify systemic design issues like chatty service patterns or inefficient fan-out calls."
Grafana Tempo is an open source distributed tracing backend designed to handle large-scale trace data cost-effectively using object storage. It works optimally as part of a comprehensive Grafana observability stack alongside tools like Prometheus and Loki. Distributed tracing solves fragmentation challenges in microservices architectures by connecting request flows across service boundaries into a unified view. This enables teams to follow trace IDs through every service, measure operation timing, correlate failures with deployments, and identify systemic design issues. Distributed tracing transforms complex production incidents into methodical debugging opportunities by providing span-level visibility across all system hops.
#distributed-tracing #grafana-tempo #microservices-observability #open-source-monitoring #cost-effective-tracing
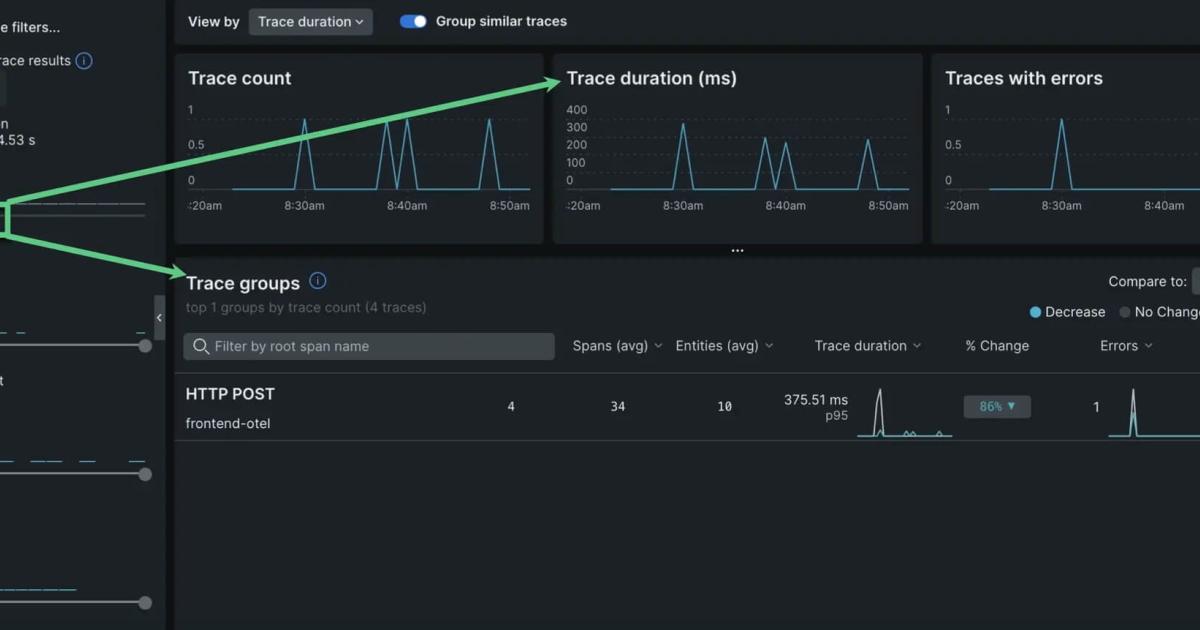
Read at New Relic
Unable to calculate read time
Collection
[
|
...
]