"You no longer have to stitch together pageview logs or guess where users are falling off. Browser User Journeys brings it all together into a single view so you are able to easily visualize what your users are doing and quickly connect that to performance data. This saves teams valuable time on manual work and enables them to focus on what's important: solving customer issues fast and delivering great experiences every time."
"Optimize outcomes: Identify the "happy path" that leads to engagement or conversion-and replicate it. Debug issues faster: Quickly isolate performance issues or frontend errors in the context of specific user paths. Prioritize what matters: Focus development effort on the journeys with the highest user impact to quickly address issues such as slow load times or errors that cause drop-offs. Improve team velocity: Reduce guesswork and redundant analysis across teams by enabling everyone to work from a shared view of the real user journeys."
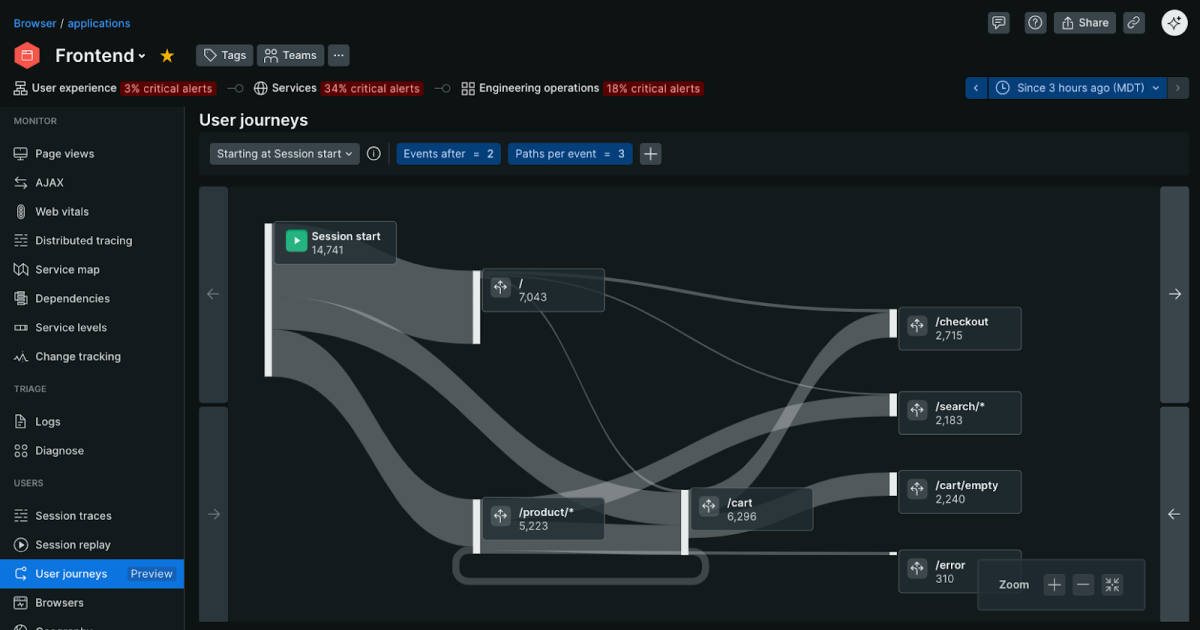
Browser User Journeys combines pageview logs and performance metrics into a single visual view so teams can see exactly what users do and where they drop off. The feature enables frontend developers, SREs, and product owners to identify successful conversion paths, rapidly isolate frontend errors and performance bottlenecks, and prioritize fixes that impact the most users. Shared journey views reduce redundant analysis and speed cross-team collaboration. The capability saves manual effort, shortens time to resolution for customer issues, and is available now within the New Relic Browser Monitoring UI, with trials and demos offered for new users.
Read at New Relic
Unable to calculate read time
Collection
[
|
...
]