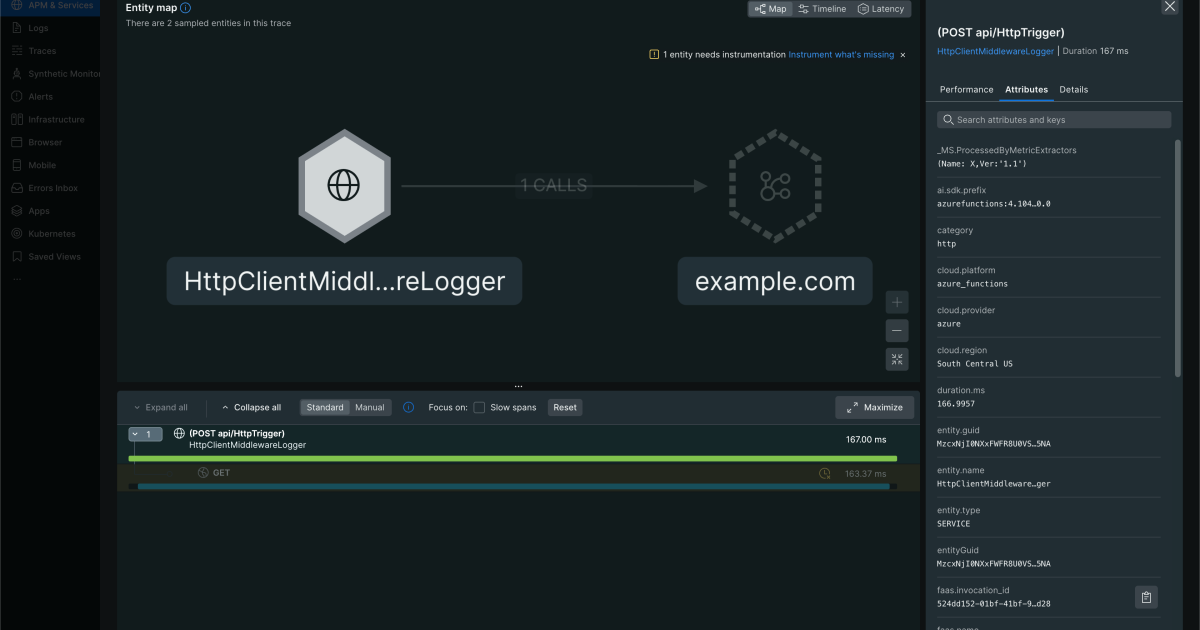
"At New Relic, we're seeing a clear trend: more and more customers are enthusiastically adopting OpenTelemetry as their standard for observability. This adoption is rapidly expanding into serverless environments like Azure Functions. As this powerful combination becomes more common, setting it up correctly is key. This guide will walk you through exactly how to instrument your DotNet Azure Functions with OpenTelemetry to get complete, end-to-end visibility in New Relic."
"Before we dive in, it's easier to think of your function app as two separate parts. I found this concept a bit tricky at first, so hopefully, this helps you get up to speed quickly without spending hours or even days figuring it out: Azure Functions Host: This is the runtime that receives the trigger (e.g., an HTTP request), manages the lifecycle, and calls your code. It has its own built-in telemetry system, which traditionally defaults to its own Application Insights pipeline."
Think of a function app as two parts: Azure Functions Host and .NET isolated worker. The Host receives triggers, manages lifecycle, and has its own telemetry system that defaults to Application Insights. The .NET isolated worker runs Program.cs and function code in a separate process where the OpenTelemetry SDK is configured. OpenTelemetry in the Functions Host (preview) supports HTTP, Service Bus, and Event Hubs triggers and exports logs, metrics, and traces to any OTLP endpoint such as New Relic's edge. By default, Host and worker processes do not automatically share telemetry context; proper configuration is required.
Read at New Relic
Unable to calculate read time
Collection
[
|
...
]