"We said, what would be a useful product for people to have as quickly as possible, since we're doing this a couple weeks after the end of the fires? And we thought trying to get as high of a resolution and as kind of as differencing as possible would be a good idea, said Brigham."
"Her team cleaned and reformatted the older, lower-resolution data and then subtracted the newer data. The resulting visualizations reveal the scale of devastation in ways satellite imagery can't match."
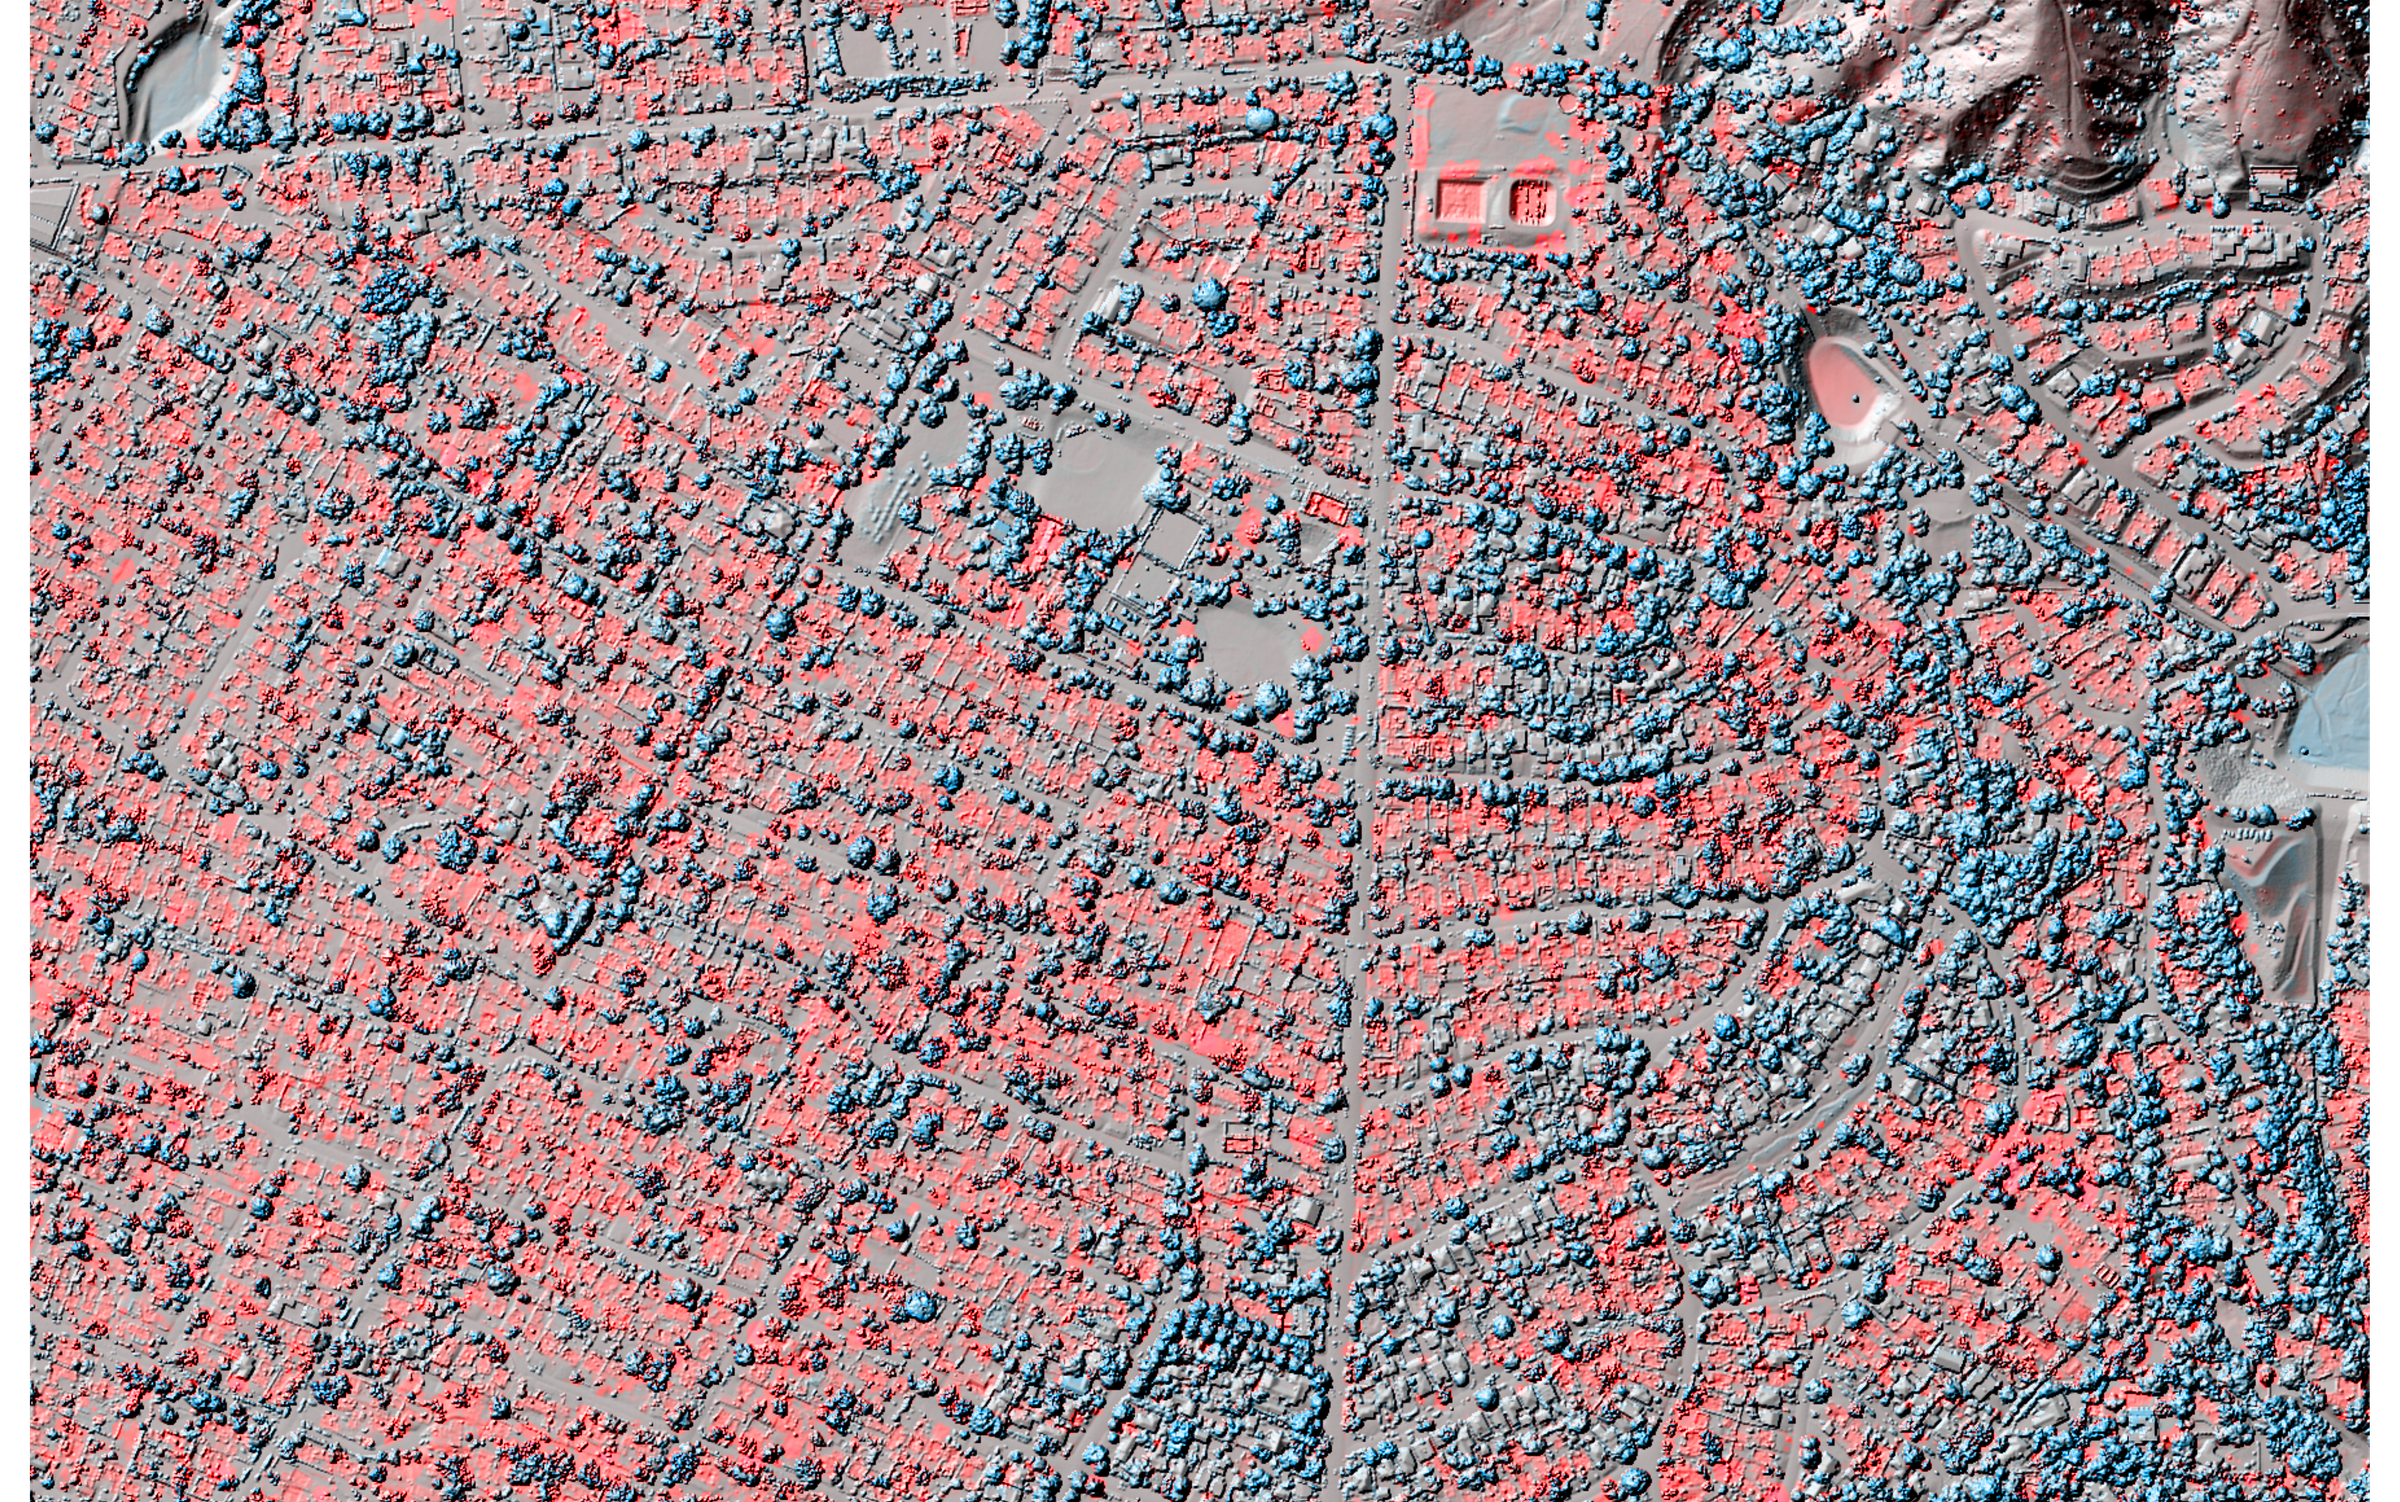
"Red shows lost elevation (like when a building burns), and blue shows a gain (such as tree growth or new construction)."
Researchers used lidar datasets from before and after fires to estimate fire damage across Southern California. The team prioritized producing a useful, rapid product within weeks of the fires and focused on maximizing spatial resolution and differencing techniques. They cleaned and reformatted older, lower-resolution lidar data, then subtracted newer data to produce differenced elevation maps. The visualizations use red to indicate lost elevation, such as burned buildings, and blue to indicate elevation gain, such as tree growth or new construction. These lidar-based maps reveal structural and terrain changes at finer detail than satellite imagery, enabling clearer assessment of devastation.
Read at flowingdata.com
Unable to calculate read time
Collection
[
|
...
]