"If active listings start to rapidly increase as homes remain on the market for longer periods, it may indicate pricing softness or weakness. Conversely, a rapid decline in active listings beyond seasonality could suggest a market that is heating up."
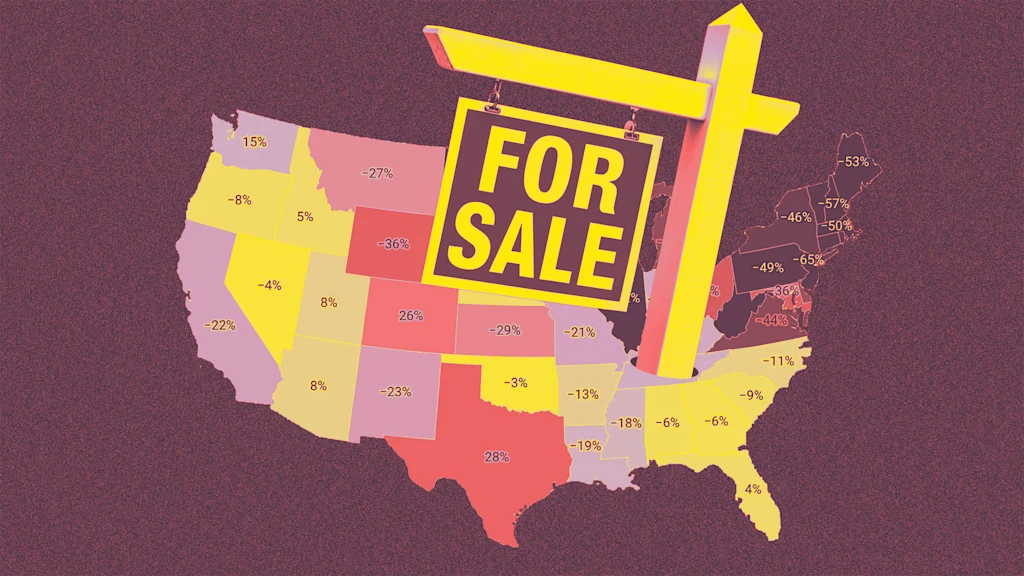
"Generally speaking, local housing markets where active inventory has jumped above pre-pandemic 2019 levels have experienced softer home price growth (or outright price declines) over the past 36 months. Conversely, local housing markets where active inventory remains far below pre-pandemic 2019 levels have, generally speaking, experienced, relatively speaking, more resilient home price growth."
"National active listings are on the rise on a year-over-year basis (+7.9% between February 28, 2025, and February 28, 2026). This indicates that homebuyers have gained some leverage in many parts of the country over the past year. Some seller's markets have turned into balanced markets, and more balanced markets have turned into buyer's markets."
Home price momentum depends significantly on monitoring active listings and months of supply. Rising active listings and longer market times suggest pricing weakness, while rapid inventory declines indicate market heating. Since the 2022 pandemic boom ended, power has shifted from sellers to buyers nationally, though unevenly across regions. Markets with active inventory above 2019 pre-pandemic levels experienced softer price growth or declines over 36 months, while markets below 2019 levels showed more resilient growth. National active listings rose 7.9% year-over-year through February 2025, converting some seller's markets to balanced or buyer's markets. However, national inventory remains 17% below February 2019 levels, with Midwest and Northeast markets still relatively tight.
#housing-market-dynamics #active-inventory-levels #home-price-momentum #buyer-vs-seller-markets #real-estate-market-trends
Read at Fast Company
Unable to calculate read time
Collection
[
|
...
]