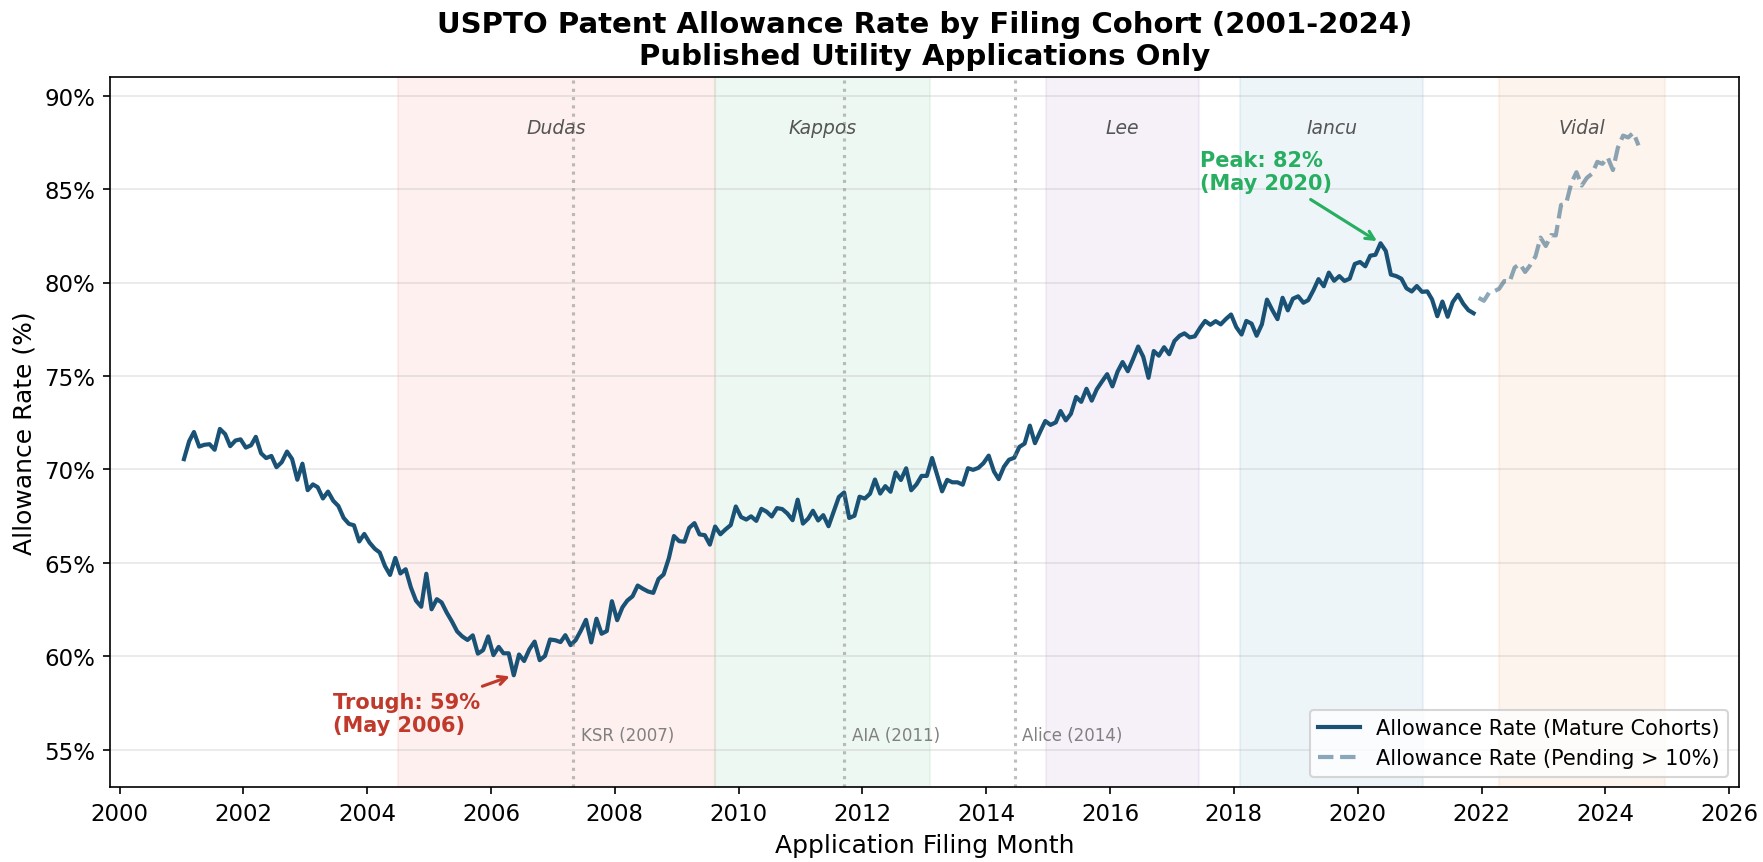
"The patent allowance rate, measured as the percentage of resolved applications that issued as patents, traces a deep V-curve across two decades. Applications filed in 2001 had an allowance rate of about 71%. That figure dropped steadily to a trough of 59% for applications filed in May 2006. It then reversed course and climbed, year after year, through 67% in 2010, 74% in 2015, and up to 82% for those filed in early 2020."
"The allowance rate is calculated as the number of applications that issued as patents divided by the number that have been resolved (issued plus abandoned), excluding applications that remain pending. For cohorts filed before late 2021, fewer than 10% of applications remain pending, making the data highly reliable. For more recent filing months, the dashed line reflects preliminary data that will almost certainly shift (downward) as the remaining applications resolve."
Patent application outcomes at the USPTO over two decades reveal a distinctive V-shaped pattern in allowance rates. Applications filed in 2001 had a 71% allowance rate, which steadily declined to reach a trough of 59% for applications filed in May 2006. Following this low point, the allowance rate reversed direction and climbed consistently, reaching 67% in 2010, 74% in 2015, and 82% for applications filed in early 2020. This represents a significant 23-percentage-point swing from the lowest to highest points. Data reliability is high for cohorts filed before late 2021, with fewer than 10% remaining pending. More recent filing months show preliminary data that may shift downward as applications continue resolving.
#patent-allowance-rates #uspto-application-trends #patent-prosecution-statistics #20-year-patent-data-analysis
Read at Patently-O
Unable to calculate read time
Collection
[
|
...
]