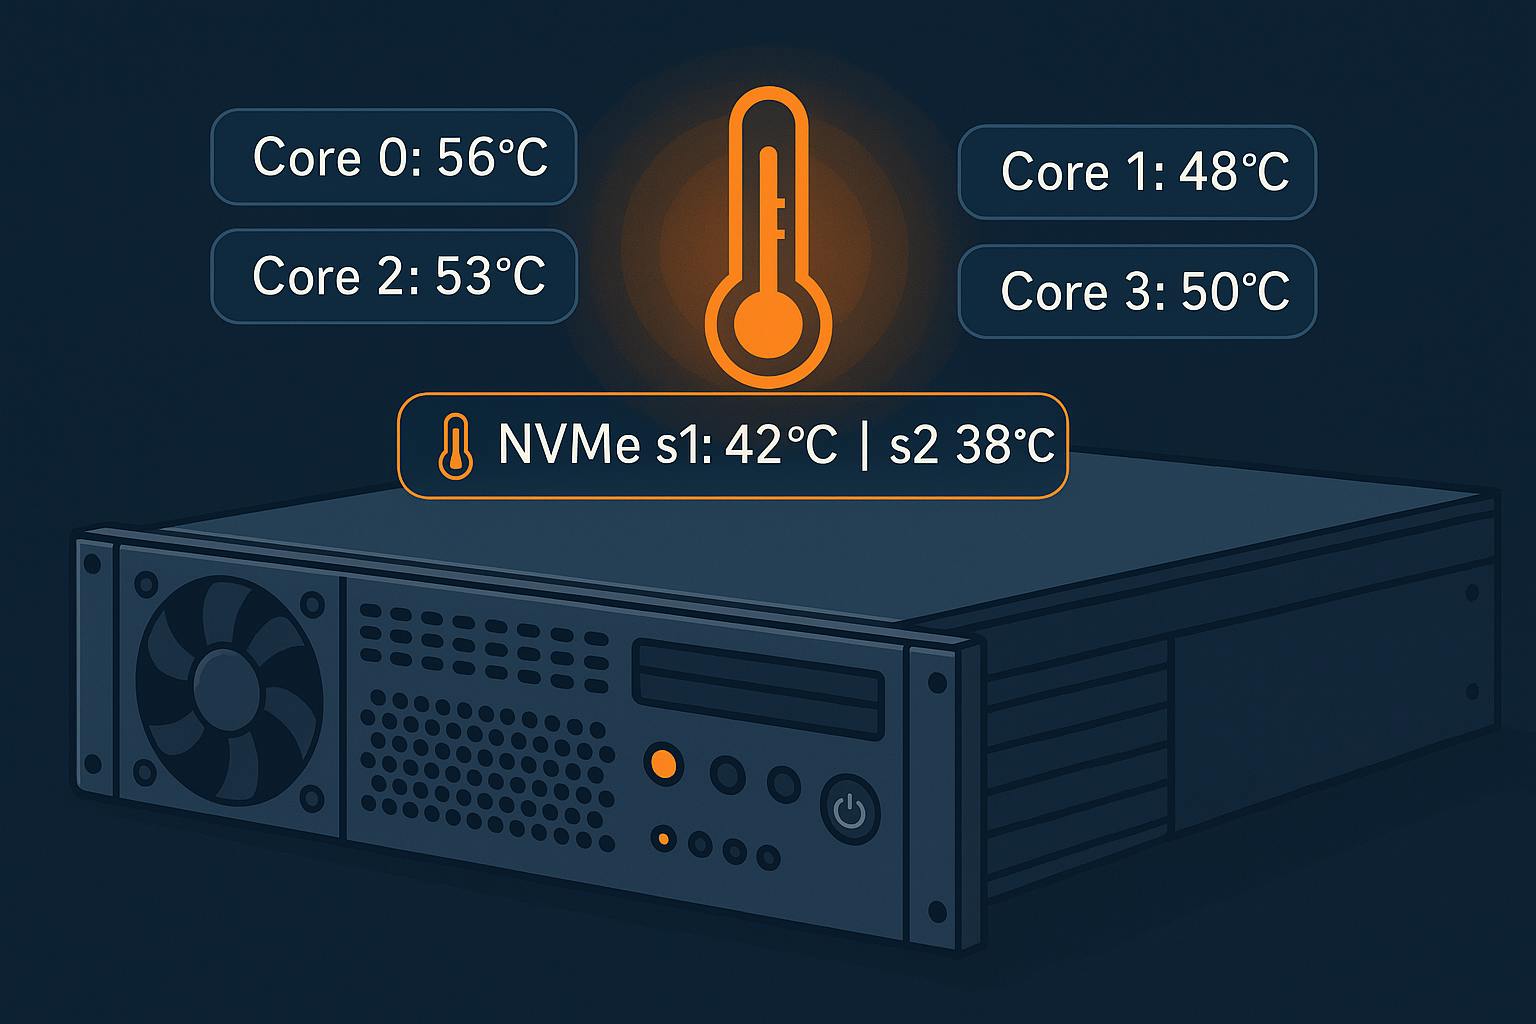
"The default Proxmox Virtual Environment (PVE) dashboard lacks detailed monitoring metrics, prompting users to enhance its functionality to view additional system metrics like CPU and SSD temperatures."
"To display additional temperature data in the PVE GUI, users can install the lm-sensors package, edit relevant Perl and JavaScript files, and modify configurations accordingly."
"Editing files like Nodes.pm and pvemanagerlib.js allows users to integrate sensor readings directly into the PVE interface, improving user access to critical system metrics."
"By following specific command-line instructions and modifying the JavaScript settings, users can enhance the Proxmox dashboard, making it more informative and responsive to system performance."
The Proxmox Virtual Environment (PVE) dashboard displays limited system information, prompting users to seek a more informative interface. To monitor additional metrics like CPU and SSD temperatures, users can leverage the lm-sensors package. By editing Perl and JavaScript files, specifically Nodes.pm and pvemanagerlib.js, users can integrate real-time temperature readings into the PVE GUI. This enhancement increases the dashboard's capacity, allowing users to access crucial system metrics directly, thereby improving their administrative experience.
Read at Hackernoon
Unable to calculate read time
Collection
[
|
...
]