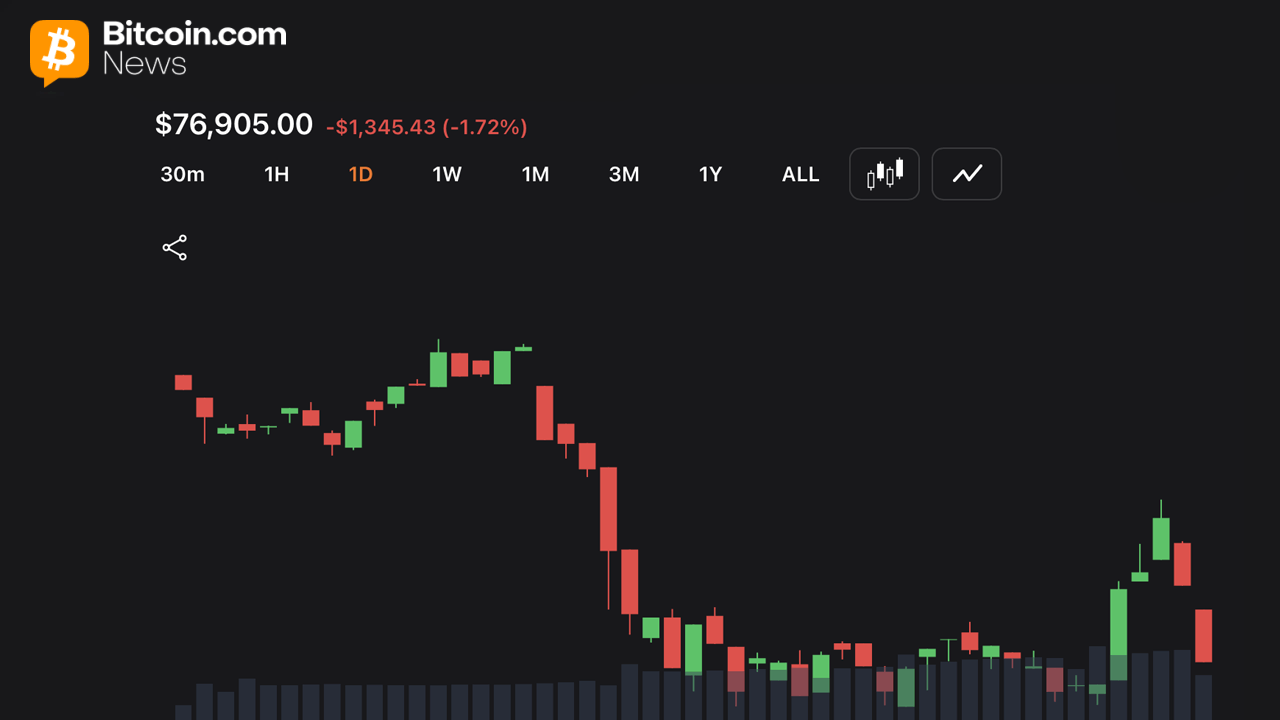
"Bitcoin trades between $76,900 to $77,465 on May 18, 2026, at 9:40 a.m. ET as traders assess mixed technical signals across multiple timeframes. While broader trend structure remains constructive above major support zones, short-term momentum indicators continue to reflect a cautious tone amid resistance near the $78,400 area."
"Market indicators show BTC momentum weakening with MACD and Momentum flashing bearish signals. Market data further shows bitcoin volume near $33 billion on Monday as traders watch $78.4K resistance. On the 1-hour chart, bitcoin continues to stabilize after a sharp selloff earlier in the session, with price action consolidating between approximately $76,700 and $78,400."
"Traders monitoring tactical entries are likely focused on whether bitcoin can regain and hold above the $77,500 threshold, which would strengthen the case for another push toward the $78,000 to $78,300 range. A breakdown beneath $76,700, however, will likely expose downside risk toward the $76,000 level."
"The 4-hour chart shows bitcoin maintaining a short-term bearish structure after producing lower highs from the recent $82,000 rejection zone. Even so, price action near the $76,800 to $77,000 region suggests a potential base could be forming as selling pressure moderates. Market participants continue to watch declining volume during the recent pullback, a condition that often signals corrective activity rather than a full reversal in trend."
Bitcoin trades between $76,900 and $77,465 around 10 a.m. ET while holding above the $76K support range. Momentum indicators show weakening conditions, with MACD and Momentum flashing bearish signals. Price stabilizes after an earlier sharp selloff, consolidating between roughly $76,700 and $78,400. Traders focus on whether BTC can reclaim and hold above $77,500 to support a move toward $78,000–$78,300. A breakdown below $76,700 would increase downside risk toward $76,000. On the 4-hour chart, lower highs from the $82,000 rejection keep a short-term bearish structure, but moderating selling pressure near $76,800–$77,000 suggests a possible base. Declining volume during the pullback points to corrective activity rather than a full reversal, with resistance concentrated near $78,500.
#bitcoin-price-action #technical-analysis #support-and-resistance #macd-and-momentum-indicators #market-volume
Read at news.bitcoin.com
Unable to calculate read time
Collection
[
|
...
]