"It's often the hidden inefficiencies that cause the most trouble: invisible bottlenecks, redundant steps, and silent resource drains. They might seem minor, but over time, their impact adds up-and your team feels it. Here's where a value chain analysis comes in handy. It breaks down business activities to identify and address inefficiencies to optimize performance. While the process is exhaustive, value chain analysis templates offer a structured framework for identifying and capitalizing on every opportunity."
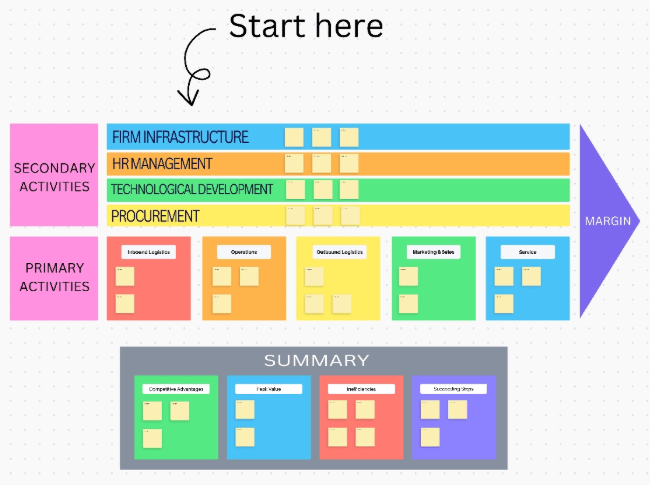
"Value chain analysis is a strategic framework developed by Michael Porter. It divides all the business activities into primary activities and secondary activities to examine each at length. Such detailed evaluation enables businesses to pinpoint inefficiencies, reduce costs, and gain a competitive advantage. As such, a value chain analysis template simplifies the process. It is a structured tool that helps businesses visualize their core activities, assess their impact, and optimize their processes."
"A well-designed value chain analysis template must possess the following qualities or features: Clear categorization: Go for a value chain analysis template with distinct sections for both primary and support activities. This makes it easier to map out each function and identify inefficiencies Visual clarity: Select a value chain analysis template that presents data as diagrams, charts, or whiteboards, allowing you to analyze how business activities are linked visually"
Value chain analysis breaks business activities into primary and support functions to examine each for inefficiencies, cost drivers, and competitive advantage opportunities. A structured template guides visualization and assessment of core activities, showing how processes interact and where value is created or lost. Templates reduce the exhaustive nature of analysis by providing organized sections and visual tools that clarify links between activities. Well-designed templates include clear categorization of primary and support activities and visual clarity through diagrams, charts, or whiteboards to simplify mapping, identification of bottlenecks, and process optimization.
Read at ClickUp
Unable to calculate read time
Collection
[
|
...
]