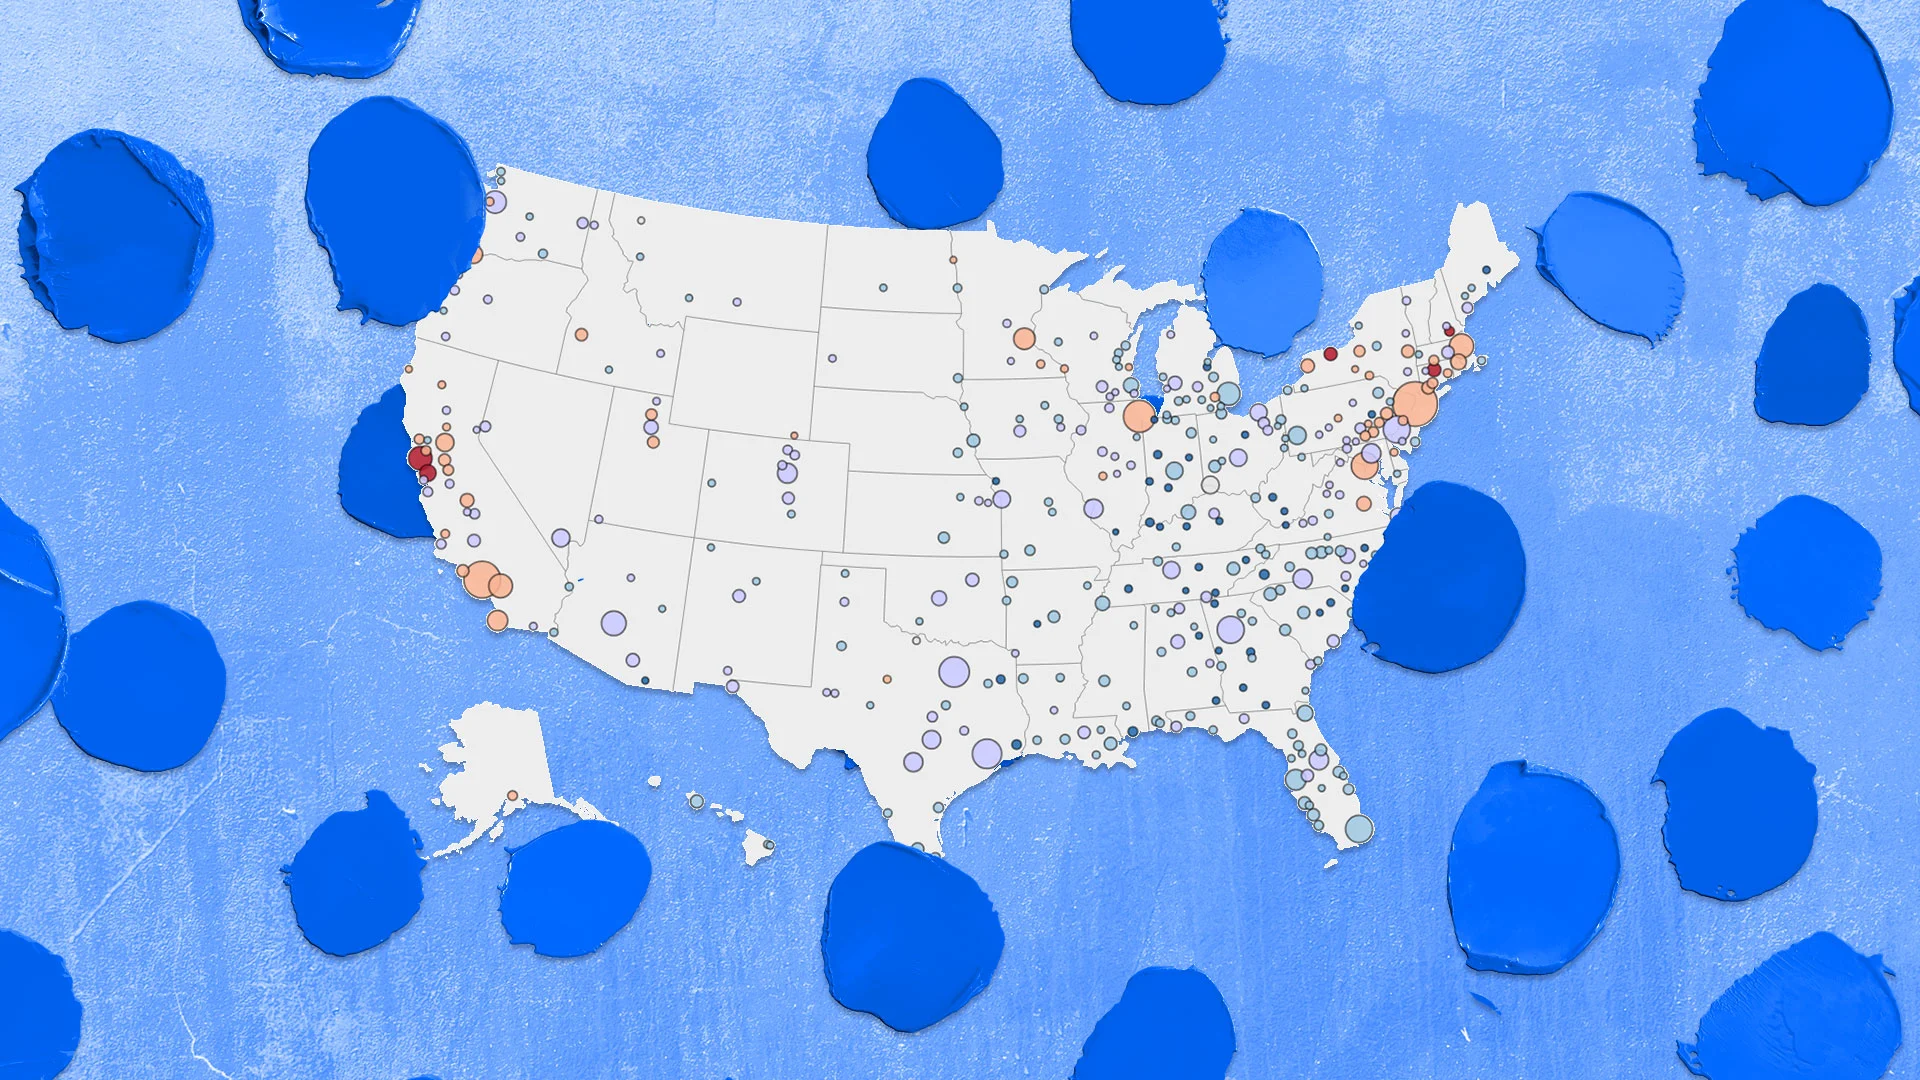
"Zillow economists use an economic model they call the Zillow Market Heat Index to gauge the competitiveness of housing markets across the country. This model looks at key indicators-including home price changes, inventory levels, and days on market-to generate a score showing whether a market favors sellers or buyers. Higher scores point to hotter, seller-friendly metro housing markets. Lower scores signal cooler markets where buyers hold more negotiating power."
"According to Zillow: Score of 70 or higher = strong seller's market Score from 55 to 69 = seller's market Score from 45 to 54 = neutral market Score from 28 to 44 = buyer's market Score of 27 or below = strong buyer's market The Zillow model shows that, directionally speaking, U.S. homebuyers have been gaining power since the pandemic housing boom fizzled out in mid 2022."
Zillow uses the Market Heat Index to measure housing market competitiveness across U.S. metros. The index combines indicators such as home price changes, inventory levels, and days on market to produce a score that signals whether a market favors sellers or buyers. Higher scores correspond to seller-friendly markets; lower scores correspond to buyer-friendly markets. Score bands classify markets from strong seller to strong buyer conditions. The index indicates U.S. homebuyers have grown stronger since the pandemic housing boom faded in mid‑2022. Regional differences show notable buyer gains around the Gulf and relative seller strength in much of the Northeast.
Read at Fast Company
Unable to calculate read time
Collection
[
|
...
]